Download
1 / 16
160 likes | 171 Views
This study investigates how cholesterol is metabolized in mouse livers using functional linear models. By examining flow curves, rate of change, and phase-plane plots, the data reveals insights into the relationship between covariates and response curves. The study also explores the inhibitory relationship between certain receptors and the effects of different time intervals. Additionally, the use of derivatives in functional linear models provides further understanding of the underlying mechanisms.

E N D
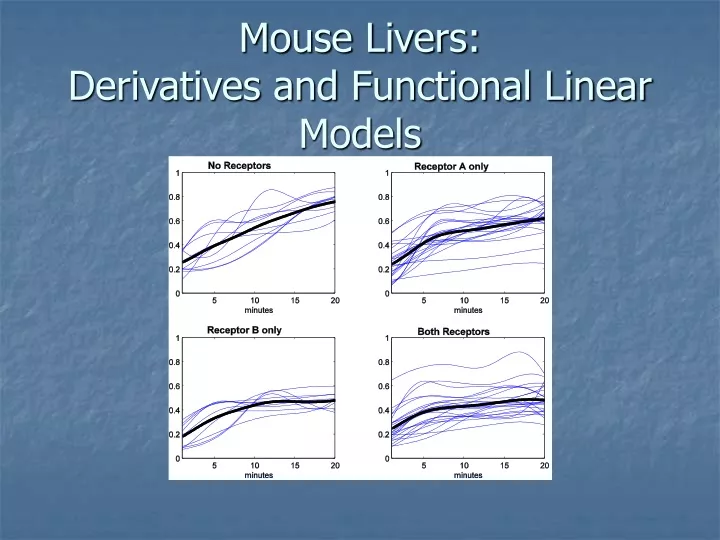
What questions can we ask of the data? • What does the real, “smooth” process look like? • Do shapes differ among groups? • Do rates of change differ among groups?
What do the flow curves look like as functional objects? • Took the derivative of the smoothed curves. • Still retain curve-to-curve variability, but now much smoother.
How can I graphically explore the data? Phase-Plane Plots • Have: • flow curves x(t). • rate of change of flow curves Dx(t). • Plot Dx(t) vs x(t). No longer an explicit function of time! • Overlay time points on the curve for interpretation. • Gives information about how function is linked with its derivative.
What do we see in these phase-plane plots? • Difference in curves between receptors and no receptors • Cusps or ‘change-points’ when there are receptors • Minute 9 for Receptor A; Minute 15 for Receptor B • Minute 9 for Both Receptors: Interactive Effect?
What is the relationship between the covariates and response curves? • Functional response; Scalar predictors. • Regression coefficients are functional. • Use basis expansion methods. Functional Linear Models X(t) = β0(t) + β1(t)A + β2(t)B + β3(t)A*B + ε(t),
Receptors affect steady state. • B stronger than A. • Effects strongest after minute 9. • A and B have inhibitory relationship after minute 9.
Receptors affect steady state. • B stronger than A. • Effects strongest after minute 9. • A and B have inhibitory relationship after minute 9.
Can also do a functional linear model for derivative (rate of change): FDA allows us to work with derivatives – which are closer to the mechanisms of the process dX/dt = β0(t) + β1(t)A + β2(t)B + β3(t)A*B + ε(t),
A “kicks in” earlier than does B. • A kicks in at minute 9, B at minute 15. • When together, see push only at minute 9 (from A?)
What have we learned? • Creating a functional object • Smoothing with basis expansions to reduce noise • Examining derivatives graphically • Phase-plane plots • Building functional linear models • Functional regression coefficients • Derivatives helpful here, too
References • Data courtesy of Allen Cooper and Kenny Yu, Palo Alto Medical Foundation & Stanford University. • For functional linear models, see Functional Data Analysis (1996), Ch. 9 – 11. • For phase-plane plots, see Applied Functional Data Analysis (2002), Ch. 3.