Download
1 / 40
410 likes | 640 Views
Production and Costs in the Short Run. Aims. The main aim of the producer is to make a profit Firms will be interested in the costs of production as well as revenue. Costs. Costs involve payment to those who have provided the resources Rent for land Wages for workers

E N D
Production and Costs in the Short Run fig
Aims • The main aim of the producer is to make a profit • Firms will be interested in the costs of production as well as revenue
Costs • Costs involve payment to those who have provided the resources • Rent for land • Wages for workers • Interest to the bank • Owner’s enterprise: normal profit the return the entrepreneur can expect to earn or the profit that a business owner considers necessary to make running the business worth his/her while
In the short run … • In the short run, because at least one factor of production is fixed, output can be increased only by adding more variable factors
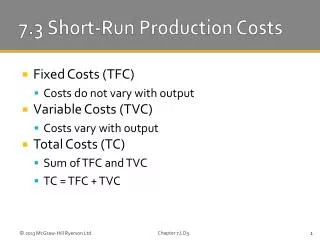
Costs • Fixed costs do not vary with output. Even if output is 0 these costs must be paid • Rent • Rates • Interest on loans • Insurance • Depreciation … ALSO CALLED OVERHEADS A change in fixed cost does not affect marginal costs
Costs • Variable costs vary with the level of production • Raw materials • Fuel • Wages (not always) • WHEN OUTPUT IS ZERO VC = 0
Output (Q) 0 1 2 3 4 5 6 7 TFC (£) 12 12 12 12 12 12 12 12 Total costs for firm X TFC
Output (Q) 0 1 2 3 4 5 6 7 TVC (£) 0 10 16 21 28 40 60 91 TFC (£) 12 12 12 12 12 12 12 12 Total costs for firm X TVC TFC
Output (Q) 0 1 2 3 4 5 6 7 TVC (£) 0 10 16 21 28 40 60 91 TC (£) 12 22 28 33 40 52 72 103 TFC (£) 12 12 12 12 12 12 12 12 Total costs for firm X TC TVC TFC
Total costs for firm X TC TVC Diminishing marginal returns set in here TFC
Wheat production per year from a particular farm Number of workers 0 1 2 3 4 5 6 7 8 Total Output 0 3 10 24 36 40 42 42 40 Tonnes of wheat produced per year fig Number of farm workers
Wheat production per year from a particular farm Total Output Tonnes of wheat produced per year fig Number of farm workers
Production in the Short Run Number of Workers 0 1 2 3 4 5 6 7 8 Total Output 0 3 10 24 36 40 42 42 40 Marginal Output 3 7 14 12 4 2 0 -2
14 12 10 8 6 4 2 0 0 1 2 3 4 5 6 7 8 -2 Wheat production per year from a particular farm Total Output Tonnes of wheat per year D Total Output = 7 Number of farm workers (L) DL = 1 Marginal Output = DTQ/ DL = 7 Tonnes of wheat per year Number of farm workers (L) fig
Wheat production per year from a particular farm Total Output Tonnes of wheat per year Number of farm workers (L) Number of Workers 0 1 2 3 4 5 6 7 8 Marginal Output 3 7 14 12 4 2 0 -2 Tonnes of wheat per year Number of farm workers (L) fig Marginal Output
Production in the Short Run Number of Workers 0 1 2 3 4 5 6 7 8 Average Output 0 3 5 8 9 8 7 6 5 Total Output 0 3 10 24 36 40 42 42 40
Production in the Short run • The short-run production function: • the graphical relationship between • total output • average output, and • marginal output
Wheat production per year from a particular farm Total Output Tonnes of wheat per year Number of farm workers (L) Marginal Output = TQ/ L Tonnes of wheat per year Average Output Number of farm workers (L) fig Marginal Output
Wheat production per year from a particular farm Total Output Tonnes of wheat per year b Diminishing returns set in here Number of farm workers (L) b Tonnes of wheat per year Average Output Number of farm workers (L) fig Marginal Output
Wheat production per year from a particular farm d Total Output Maximum output Tonnes of wheat per year b Number of farm workers (L) b Tonnes of wheat per year Average Output d Number of farm workers (L) fig Marginal Output
Total Costs TC = VC + FC Costs Output
Use the same information • Calculate and draw: • Average Fixed Cost curve • Average Variable Cost curve • Average Total Cost curve • Homework page 54 in notes booklet
Average Cost Curve • Falling Costs • Constant Costs • Rising Costs
Marginal Cost • The extra cost of producing one more unit of output • Costs which change when output changes are variable costs – NOT FIXED COSTS • MC = the additional VC when one extra unit is produced • NOW PLOT MARGINAL COST ON YOUR CURVE
Costs in the Short Run Output (Q) 0 1 2 3 4 5 6 7 TVC (£) 0 10 16 21 28 40 60 91 TC (£) 12 22 28 33 40 52 72 103 MC (£) 10 6 5 7 12 20 31
Marginal cost MC Costs (£) x fig Output (Q)
Marginal cost MC Costs (£) Diminishing Returns start at X x fig Output (Q)
Diminishing Returns Defined • In the short run, the law of diminishing returns states that as we add more units of a variable input (i.e. labour or raw materials) to fixed amounts of land and capital, the change in total output will at first rise and then fall • Diminishing returns to labour occurs when marginal product of labour starts to fall. This means that total output will still be rising – but increasing at a decreasing rate as more workers are employed
Costs in the Short Run Average Variable Cost (£) - 10 8 7 7 8 10 13 Output (Q) 0 1 2 3 4 5 6 7 TVC (£) 0 10 16 21 28 40 60 91
Average and marginal costs MC AVC Costs (£) y x fig Output (Q)
Costs in the Short Run Output (Q) 0 1 2 3 4 5 6 7 TFC (£) 12 12 12 12 12 12 12 12 AFC (£) - 12 6 4 3 2.4 2 1.7
Average and marginal costs MC AVC Costs (£) y x AFC Output (Q) fig
Costs in the Short Run Output (Q) 0 1 2 3 4 5 6 7 TC (£) 12 22 28 33 40 52 72 103 Average Cost (£) - 22 14 11 10 10.4 12 14.7
Average and marginal costs AC MC AVC Costs (£) z y x AFC fig Output (Q)
Relationship between Marginal and Average Costs • Both are U shaped, MC is steeper • When MC is below AC, AC is falling • When MC is above AC, AC is rising • When the curves cross MC=AC • This is the optimum point The marginal cost curve cuts the AVC and AC curves at their lowest point
Production in the Short run • Periods of Supply, not time- • Short-run : • production capacity is fixed • fixed and variable factors of production • at least one factor is fixed e.g. land • others can be changed e.g. labour • The long run: • All factors become variable