Download
1 / 22
240 likes | 353 Views
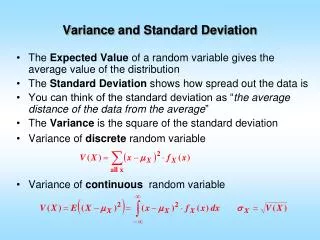
This chapter outlines the concepts of mean, variance, standard deviation, and Z-scores in research articles, highlighting the importance of variability in data sets. Learn how to calculate variance and standard deviation, and understand the impact of mean and standard deviation on data distribution.

E N D
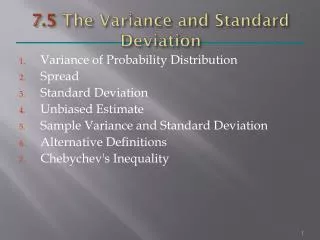
Chapter Outline • Representative Values • Variability • Mean, Variance, Standard Deviation, and Z Scores in Research Articles
High or Low Variability Data Sets: Data 1: 10, 10, 10, 10, 11 ?? Data 2: 10, 11, 13, 15, 17 ?? Data 3: 10, 20, 30, 40, 50 ?? Data 4: 10, 50, 90, 100, 150 ??
High Variability Almost Flat Low Variability Scores close too µ
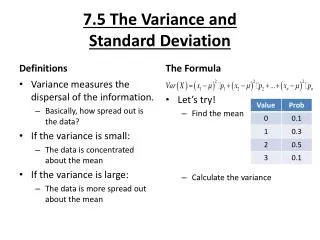
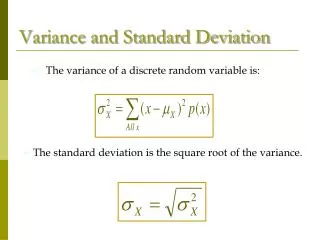
Variance (SD2) • Measure of how spread out a set of scores are • average of the squared deviations from the mean Standard Deviation (SD) • Most widely used way of describing the spread of a group of scores • the positive square root of the variance • the average amount the scores differ from the mean • To calculate SD: • Take the square root of SD2.
Formulas for SD2 and SD • Variance (SD2): average of the squared deviations from the mean • SD2 = ∑(X-M)2 N • Standard Deviation (SD): • √SD2
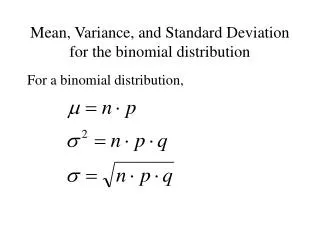
Variance Sample variance Population variance
8-4 = 4 X 42
Computing SD2 & SD Step 1: Data • SD2 = ∑(X-M)2 N Step 2 Deviation scores: • X - M 7 – 6 = 1 8 – 6 = 2 8 – 6 = 2 7 – 6 = 1 3 – 6 = -3 1 – 6 = -5 6 – 6 = 0 9 – 6 = 3 3 – 6 = -3 8 – 6 = 2 • X 7 8 8 7 3 1 6 9 3 8
Calculate SD2 & SD Variance SD2 = ∑(X-M)2 N SD2 = 66 10 SD2 = 6.60 Step 5
Amount of Variation and Mean are Independent Can have a distribution with same means BUT DIFFERENT SDs Can have a Distribution with same SDs BUT DIFFERENT MEANS
Variability How spread out the scores are in a distribution • amount of spread of the scores around the mean • Distributions with the same mean can have very different amounts of spread around the mean. Mean1 = 50, SD = 3 Mean2 = 50, SD = 20 • Distributions with different means can have the same amount of spread around the mean. • Mean1 = 25, SD = 3 • Mean2 = 50, SD = 3
How Are You Doing? • What do the SD2 and SD tell you about a distribution of scores? • What are the formulas for finding the variance and standard deviation of a group of scores?
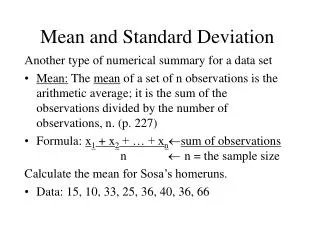
Key Points • The mean (M = (∑X) / N) is the most commonly used way of describing the representative value of a group of scores. • The mode (most common value) and the median (middle value) are other types of representative values. • Variability refers to the spread of scores on a distribution. • Variance and standard deviation are used to describe variability. • The variance is the average of the squared deviations of each score from the mean ([∑ (X-M)2] / N). • The standard deviation is the square root of the variance(√SD2). • A Z score is the number of standard deviations that a raw score is above or below the mean (Z = (X-M) / SD). • Means and standard deviations are often reported in research articles.
Key Points • The mean (M = (∑X) / N) is the most commonly used way of describing the representative value of a group of scores. • The mode (most common value) and the median (middle value) are other types of representative values. • Variability refers to the spread of scores on a distribution. • Variance and standard deviation are used to describe variability. • The variance is the average of the squared deviations of each score from the mean ([∑ (X-M)2] / N). • The standard deviation is the square root of the variance(√SD2). • A Z score is the number of standard deviations that a raw score is above or below the mean (Z = (X-M) / SD). • Means and standard deviations are often reported in research articles.