Download
1 / 12
120 likes | 217 Views
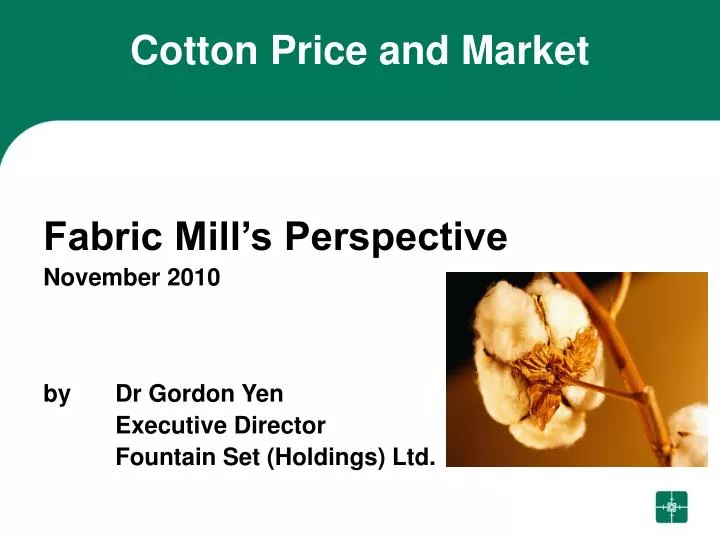
Fabric Mill’s Perspective November 2010 by Dr Gordon Yen Executive Director Fountain Set (Holdings) Ltd. Cotton Price and Market. Price Trend 2010. Cotton #2 (NYBOT). Corn (CBOT). Soybeans (CBOT). Source: TFC Commodity Charts. Yarns $330k/mth. Fabrics $550k/mth.

E N D
Fabric Mill’s Perspective November 2010 by Dr Gordon Yen Executive Director Fountain Set (Holdings) Ltd. Cotton Price and Market
Price Trend 2010 Cotton #2 (NYBOT) Corn (CBOT) Soybeans (CBOT) Source: TFC Commodity Charts
Yarns $330k/mth Fabrics $550k/mth Inventory Exposure of Supply Chain Cotton$231k/mth GarmentFOB = $1M /mth $ 550k x 60% (Cost % of Raw Material over sales) x 4 months $ 1M x 55% (Cost % of Raw Material over sales) x 2 months $ 330k x 70% (Cost % of Raw Material over sales) x 6 months
Cotton 70% Yarns 60% Fabric 55% + 35.4% + 8.1% + 28.1% + 115% Impact of Price Increase on Material Cost Assuming no inflation in processing cost
…didn’t fabric mills and spinners make BIG margins? Who Made Money?? Some say… ?
Cotton 70% Yarns 60% Fabric 55% + 14.7% + 49.8% Theoretical Price Increase of Fabric Fabric Value Based on Nov Index Cotton US$2.5/lb US$4.3/lb 71.8% Assuming no inflation in processing cost
…people who had a big pile of EXTRA cotton… So Who Made Money??
Cotton 70% Yarns 60% Fabric 55% Impact of Price Increase on Inventory Increase in working capital increases cost and reduces ROI 2 months 4 months 6 months Depending on season
Other Factors Increasing Costs and Working Capital • Shortening of payment period: From Open Account to CBD, Down Payments • Other costs inflations: wages, chemicals, energy, etc • Tightening of Credit Terms Throughout Supply Chain: Full or Partial CBD, Down Payments
Price Trend 2010 ? Cotton #2 (NYBOT) Corn (CBOT) Soybeans (CBOT) Source: TFC Commodity Charts
Will History Repeat Itself? 2010 2003 2004 Source: TFC Commodity Charts