Download
1 / 86
860 likes | 888 Views
Explore nutrient dynamics in Puget Sound using a blend of direct observations and computer models to study the interactions of physical, chemical, and biological processes. Learn how human activities and climate impact water properties and ecosystem health.

E N D
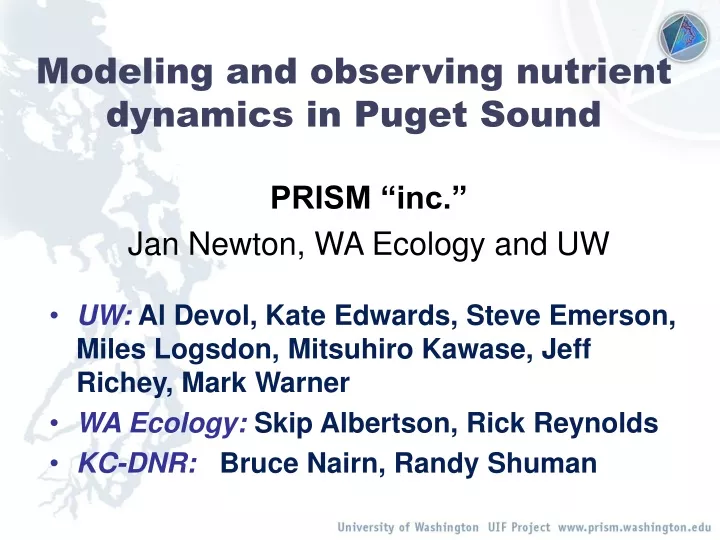
Modeling and observing nutrient dynamics in Puget Sound PRISM “inc.” Jan Newton, WA Ecology and UW • UW: Al Devol, Kate Edwards, Steve Emerson, Miles Logsdon, Mitsuhiro Kawase, Jeff Richey, Mark Warner • WA Ecology: Skip Albertson, Rick Reynolds • KC-DNR: Bruce Nairn, Randy Shuman
{ CO2 + H2O C(H2O) + O2 } sunlight nutrients Lo nutrient Hi oxygen Phytoplankton present Phytoplankton present Hi nutrient Lo oxygen No phytoplankton No phytoplankton
Lo nutrient Hi oxygen Phytoplankton present Hi nutrient Lo oxygen No phytoplankton { CO2 + H2O C(H2O) + O2 } sunlight nutrients 3 common problems in oceanography: Nutrient concentration: what does it really tell us? Advection vs. growth: how do you differentiate? µ = delta P / [P * time] we can’t easily measure it!
What is an estuary ?? ocean river
Strait of Georgia NE Pacific Ocean Strait of Juan de Fuca Puget Sound Grays Harbor Willapa Bay
Re Puget Sound • Dynamic and diverse • Scales of variation: • temporal • spatial • Boundary conditions: • ocean, river, atmosphere • Drivers of change: • Climate • Humans • Investigative tools: • Monitoring – Observing – Time-Series • Models, Experimentation
Pacific climate variability, 1900-1998 Steven Hare, UW, 1999
Ocean properties are not “constant”... The depth of the thermocline was much deeper following El Niňo than La Niňa. This affects not only the temperature but also the nutrients available at the surface. In fact, we did find more phytoplankton on the coast during summer of 1999 than 1998. 110 m Depth (m) April 1998 10 m Depth (m) April 1999 Smith et al. 2000 Distance from shore (km)
Effect of a drought on river flow… USGS, 2000
Lo nutrient Hi oxygen Phytoplankton present Hi nutrient Lo oxygen No phytoplankton * sunlight nutrients So what do humans do?? Add “new” nutrients from human activity: fertilized lawns, sewers, leaking septic tanks, animals, etc. Lo oxygen can get lower !!! { CO2 + H2O C(H2O) + O2 }
Lo nutrient Hi oxygen Phytoplankton present Hi nutrient Lo oxygen No phytoplankton * sunlight nutrients So what do humans do?? Add “new” nutrients from human activity: fertilized lawns, sewers, leaking septic tanks, animals, etc. Lo oxygen can get lower !!! { CO2 + H2O C(H2O) + O2 }
Overarching Goal “Through a strongly interacting combination of direct observations and computer models representing physical, chemical, and biological processes in Puget Sound, provide a record of Puget Sound water properties, as well as model now-casts and projections. The information will be used to develop a mechanistic understanding of the Sound’s dynamics, how human actions and climate influence these (e.g., “what-if scenarios”), and how, in turn, water properties influence marine resources and ecosystem health (linkage with other PRISM elements).”
Key questions • Understanding plankton dynamics in a temperate fjord: - What physical dynamics of water mass variation most influence stratification, and what is the phytoplankton response? - How important is nitrate versus ammonium in controlling phytoplankton production? - What controls light availability for phytoplankton in the euphotic zone? • Assessing ecosystem integrity: - Do salmon have food they need to survive? Is timing ok and what affects that? - What food-web shifts (e.g., macrozoops vs. gelatinous) affect fish etc survival? - How does an invasive species with certain growth/grazing characteristics impact food-web? • Understanding perturbation impacts (e.g., climate, human): - How does productivity differ with ENSO and PDO stages? - How does flushing differ with ENSO and PDO stages? - Do land-use practices affect water properties and phytoplankton?
Uses and benefits • The information will be used • for teaching at various levels • to promote and aid research • to help define effective regional planning • Public benefit includes: • Resource and habitat protection (e.g., clean water, fish, shellfish) • Waste/pollution planning and allocation • Puget Sound quality maintenance
Partnerships/ Monitoring Observations Virtual Puget Sound Remote sensing Climate variation impacts Modeling
Partnerships/ Monitoring Observations Virtual Puget Sound Remote sensing Climate variation impacts Modeling
Partnerships/ Monitoring Observations Virtual Puget Sound Remote sensing Climate variation impacts Modeling
Marine Water Quality Index Ships & Buoys
Partnerships/ Monitoring Observations Virtual Puget Sound Remote sensing Climate variation impacts Modeling
Marine Water Quality Index Ships & Buoys Remote sensing
Partnerships/ Monitoring Observations Virtual Puget Sound Remote sensing Climate variation impacts Modeling
Marine Water Quality Index Ships & Buoys El Niño vs La Niña Remote sensing
Partnerships/ Monitoring Observations Virtual Puget Sound Remote sensing Climate variation impacts Modeling
Marine Water Quality Index Ships & Buoys El Niño vs La Niña Remote sensing Aquatic biogeochemical cycling model
Marine Water Quality Index Ships & Buoys El Niño vs La Niña Remote sensing Aquatic biogeochemical cycling model
Partnerships/ Monitoring Observations Virtual Puget Sound Remote sensing Climate variation impacts Modeling
Observing Nutrient Dynamics PRISM Observations • PRISM-sponsored cruises • Partnership with WA Ecology and King Co DNR monitoring (PSAMP) • JEMS: Joint Effort to Monitor the Strait, co-sponsored by MEHP, et al. • ORCA: Ocean Remote Chemical-optical Analyzer, initial sponsorship EPA/NASA, also WA SG, KC-DNR
PRISM cruises • Annual June and Dec. cruises; 10 so far • Greater Puget Sound including Straits • Synoptic hydrographic, chemical, and biological data • Input for models, student theses, regional assessments
Value of a PRISM cruise? • Student training and involvement • UG and G; majors and non-majors • Data collection on synoptic basis • verification for models • time-series at solstices • Involvement of larger community • media, K-12, other marine programs, local governments
PRISM cruise participation: • UW Undergraduates - 34 persons, 60 trips (41%) • Oceanography - 30 • Other Majors - 4 [UW Tacoma , Biochemistry, Computer Sci, Fisheries] • UW Grad Students- 21 persons, 23 trips (16%) • Oceanography - 11 • Other Majors - 10 [Chem, Geol, Appl Math, Biol, Genetics, Sci Ed, Foriegn] • WA State Dept. Ecology - 8 persons, 20 trips • UW Faculty - 4 persons, 13 trips • King County DNR - 4 persons, 5 trips • US Coast Guard Techs - 6 persons • Congressional Staff - 6 persons • Media - 4 persons Totals : 94 persons, 146 trips • UW Staff - 3 persons 57% student labor • CORE - 2 persons • NOAA/PMEL - 1 person • Ocean Inquiry Project - 1 person • High School Teacher - 1 person Data after 7 cruises:
PRISM Observations: Hood Canal Oxygen and Ammonium
Joint Effort to Monitor the Strait (JEMS) JEMS line King County MEHP PRISM Ecology NOAA Friday Harbor Labs
bottle samples (0, 30, 80, 140 m) - Oxygen - Nutrients - Chlorophyll a • sensor profiles • - Temperature • - Salinity • - Density • Oxygen • Chlorophyll a JEMS visits the three stations monthly. Data collection began September 1999 and is ongoing. net tows - Plankton - Larvae
Temperature With 2 1/2 years of data we can begin to study the interannual variation of water properties passing through the Strait and into the Puget Sound. Determining the inter-annual variation of water properties in the Strait is necessary for understanding variation in San Juans and Puget Sound.
Salinity Local: High salinity at depth on US side. Low salinity at surface on Canadian side. Annual: Low salinity water mixes down during winter. High salinity water enters during summer. Interannual: 2000-2001 drought is easily observed.
Temperature Salinity Q1: What effects can we expect from climate variation ?? Compare Sept 2000 with Sept 2001
How did the environment vary in 2000 vs. 2001? Air Temperature: No apparent difference Sunlight: No apparentdifference Upwelling: No apparentdifference River Discharge: Drought, Fall 2000 Increased flow, Fall 2001 Skagit River Discharge
North Canada South U.S.A. fresher, warmer water from Sound and San Juans flowing out colder, salty water from Pacific Ocean flowing in
Cross-Channel Density Gradient Warmer fresher water drives stronger density gradient during Sep 2001 than in Sep 2000 North South
Geostrophic Velocity High River Flow Large Cross- Channel Gradient Increased Geostrophic Out Flow Decreased Residence Time 2000 drought had consequences…
Q2: Where is Puget Sound most sensitive to nutrient loading and are affects being seen ?? • Partnership:Ecology PSAMP monitoring • Analysis of monitoring data identified South Puget Sound as an area susceptible to eutrophication • Led to focused study on South Sound nutrient sensitivity (SPASM) • Coordination of SPASM and PRISM modeling/observ. http://www.ecy.wa.gov/
Primary Production (mg C m-2 d-1) >1000-2000>2000-3000 >3000-4000 >4000-5000 1500 n=8 2186 1983 2340 n=30 2360 2900 3225 n=19 4625 n=19 ~3000 Newton et al., 2001 3412 n=5 x 80 ~2000
% increase in integrated / surface prod’n <5 / <10>5-15 / >10-30 >15-25 / >30-50 >25-35 / >50-70 >35 / >70 4/11 15/20 9/14 10/16 13/17 28/78 32/ 79 11/ 152 15/ 51 Newton et al., 2001
Effect of added nutrients: Hood Canal South Sound Central Basin Newton et al., 2001
0 200 400 600 0 500 1000 0 500 1000 0 0 0 5 5 5 blue = ambient production 10 red = spiked with NH4 & PO4 15 10 10 20 10 Jul 00 12 Oct 00 25 Sep 00 15 25 15 Effect of nutrient addition on phytoplankton productivity Carr Inlet, WA Ecology primary productivity (mg C m-3 d-1) depth (m) Newton and Reynolds, 2002 enhancement surface enhancement no enhancement July 12 - 28, 2000 Sept. 20- Oct. 2, 2000 October 15-21, 2000 Sigma-t Chl ug/l ORCA website O2 mg/l enhancement no enhancement surface enhancement
0 200 400 600 0 500 1000 0 500 1000 0 0 0 5 5 5 blue = ambient production 10 red = spiked with NH4 & PO4 15 10 10 20 10 Jul 00 12 Oct 00 25 Sep 00 15 25 15 Effect of nutrient addition on phytoplankton productivity Carr Inlet, WA Ecology primary productivity (mg C m-3 d-1) depth (m) Newton and Reynolds, 2002 enhancement surface enhancement no enhancement July 12 - 28, 2000 Sept. 20- Oct. 2, 2000 October 15-21, 2000 Sigma-t Chl ug/l ORCA website O2 mg/l enhancement no enhancement surface enhancement
Q3: “What if” we built a new outfall in Central Puget Sound ?? • Partnership: KC-DNR’s WWTP siting • Region’s growth is requiring greater capacity to treat wastewater. New WWTP proposed. • KC MOSS study to site marine outfall and assess potential impacts • Coordinated modeling and observ. effort with PRISM Marine outfall zones with depth contours http://www.metrokc.gov/
Modeling Nutrient DynamicsPRISM Models • POM model: Princeton Ocean model, hydrodynamics • ABC model:Aquatic Biogeochemical Cycling