Download
1 / 18
180 likes | 339 Views
Write down this problem on your READY RECALL SHEET. NUMBERS DON’T LIE . . . but do graphs? Which graph is deceiptful ? And why? WRITE IT DOWN. Go. ITEMS of BUSINESS. REWORK is due April 29/30, next TUES/WED. This must be in on-time in order to retake the test.

E N D
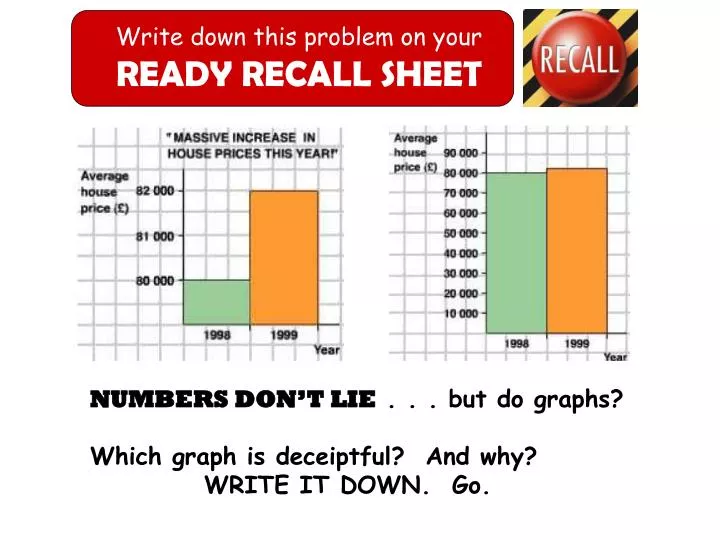
Write down this problem on your READY RECALL SHEET NUMBERS DON’T LIE . . . but do graphs? Which graph is deceiptful? And why? WRITE IT DOWN. Go.
ITEMS of BUSINESS REWORK is due April 29/30, next TUES/WED. This must be in on-time in order to retake the test. Retakes are highly recommended if you scored 79% or less. It’s the BEST way to bring up your grade! WARNING: This is the ONLY chapter test you will have an opportunity to retake this term.
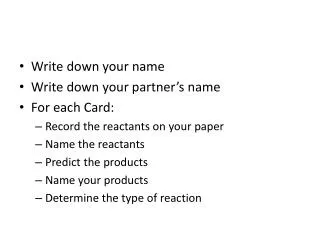
Questions on Homework? then Trade-n-Grade
BIVARIATE DATA % of people with a college degree Per Capita Income 16.2 Lines of Best Fit
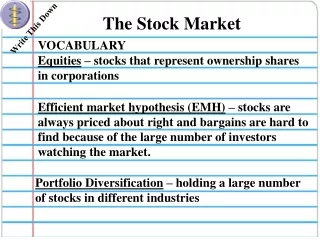
VOCAB REVIEW Take notes. There will be an open notes quiz following this review.
DEPENDENT vs. INDEPENDENT 3 things you’ll see: ASSOCIATION DEPENDENCE NO ASSOCIATION NO DEPENDENCE ASSOCIATION NO DEPENDENCE Can go either place. Can go either place. Math grade Blink time Foot size Time spent gaming Hair length Hand size Doesn’t matter what goes where. Doesn’t matter what goes where. Dependent goes here.
ASSOCIATION vs. NO ASSOCIATION Association No association Points seem to go in one direction. Points have NO direction. Good for NOTHING. Good for predictions. y = mx + b
CLUSTERING vs. OUTLIERS Perfect clustering Loose clustering Tight clustering CLUSTERING: Points seem to fall within a defined space. OUTLIERS: Points outside that defined space. They are often disregarded. Sad, but true.
POSITIVE vs. NEGATIVE association + - + + POSITIVE NEGATIVE One increases, the other decreases. “DOWNHILL” *They OPPOSE each other! Both are increasing. “UPHILL” *They AGREE with each other!
LINEAR vs. NON-LINEAR NON-LINEAR LINEAR Does NOT follow a straight line. Follows a STRAIGHT line. * Remember, “lines” in math are straight. y = mx + b
START on the QUIZ You may use your notes (INB).
Get into your Groups i-can use a line to predict the foot sizeof a person with a 30cm hand. LINES Of BEST FIT Pages XX of your INB
HOW TO: draw a line of best fit Do the next 3 slides with the students. Step 1 is to nix any outliers. Step 2 is to draw an oval around the data. Step 3 is to draw a line half-way through the oval, hitting as many points as possible. In the first graph, they will think the bottom left is an outlier, but after drawing the line, alas it is ON the line!! Outliers are FAR AWAY from your line of best fit. FOLLOW ALONG
HOW TO: draw a line of best fit FOLLOW ALONG
HOW TO: draw a line of best fit FOLLOW ALONG
The REEL DEAL: Making predictions using lines of best fit. I just played the video clip. No introduction. Kids won’t ask. They are just happy to do something they think is not related to math for a second. Then I ask them, how long is that movie, anyway?? Write down the guesses on the board. The actual time is 143 minutes (2:23). We then look at their worksheet and start doing the problems together. They have LOTS of good reasons movies have been getting longer and longer! Click to preview
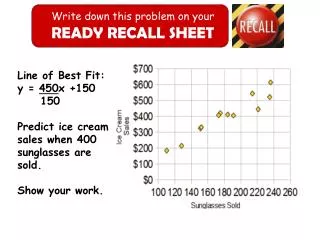
16.2 Lines of Best Fit Day 1 – Integer operations, PEMDAS, evaluating i-can use a line of best fit to predict the foot size of a person with a 20cm hand. ≈ 33cm 33 20
Write down today’s homework on your CALENDAR CARD. Green & Tan Worksheets 16.2 Lines of Best Fit & The Reel Deal SHOW YOUR WORK