Download
1 / 61
610 likes | 628 Views
Explore results of profile inversion and cloud classification with MPI MiniMAX-DOAS measurements during CINDI. The study includes aerosol, NO2, OD correlations with AERONET, surface extinction, and more. Learn about the MPI MAX-DOAS inversion scheme and its applications.

E N D
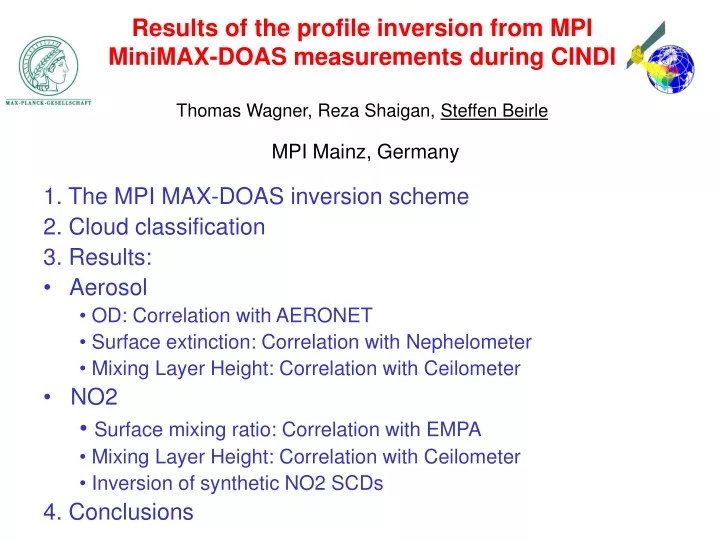
Results of the profile inversion from MPI MiniMAX-DOAS measurements during CINDI Thomas Wagner, Reza Shaigan, Steffen Beirle MPI Mainz, Germany • 1. The MPI MAX-DOAS inversion scheme • 2. Cloud classification • 3. Results: • Aerosol • OD: Correlation with AERONET • Surface extinction: Correlation with Nephelometer • Mixing Layer Height: Correlation with Ceilometer • NO2 • Surface mixing ratio: Correlation with EMPA • Mixing Layer Height: Correlation with Ceilometer • Inversion of synthetic NO2 SCDs • 4. Conclusions
1. The MPI MAX-DOAS inversion scheme Aerosol profiles are parametrised by 3 parameters: following the ideas of Li, X., Brauers, T., Shao, M., Garland, R. M., Wagner, T., Deutschmann, T., and Wahner, A.: MAX-DOAS measurements in southern China: retrieval of aerosol extinctions and validation using ground-based in-situ data, Atmos. Chem. Phys., 10, 2079-2089, 2010. A) vertical optical depth OD(related to total aerosol amount) B) mixing layer height MLH(important atmospheric parameter) C) fraction of total optical depth in boundary layer (allows to adjust vertical profile, depending e.g. on vertical mixing into free troposphere) f = 0.9 90% Constant extinction in ML, exponential decrease above
1. The MPI MAX-DOAS inversion scheme Aerosol profiles are parametrised by 3 parameters: following the ideas of Li, X., Brauers, T., Shao, M., Garland, R. M., Wagner, T., Deutschmann, T., and Wahner, A.: MAX-DOAS measurements in southern China: retrieval of aerosol extinctions and validation using ground-based in-situ data, Atmos. Chem. Phys., 10, 2079-2089, 2010. New (since Nov. 2009): f > 1: Profiles with elevated layers f = 1.5
1. The MPI MAX-DOAS inversion scheme Aerosol profiles are parametrised by 3 parameters: following the ideas of Li, X., Brauers, T., Shao, M., Garland, R. M., Wagner, T., Deutschmann, T., and Wahner, A.: MAX-DOAS measurements in southern China: retrieval of aerosol extinctions and validation using ground-based in-situ data, Atmos. Chem. Phys., 10, 2079-2089, 2010. New (since Nov. 2009): f > 1: Profiles with elevated layers f = 1.1 Multi-layer aerosols can not be described by this parametrisation
1. The MPI MAX-DOAS inversion scheme • Modelling of O4 AMFs: • Radiative transfer modelling: • Backward Monte-Carlo RTM McArTim (Deutschmann, 2009) • Surface albedo: 5% • Surface altitude of measurement site • Pressure and temperature profiles from US standard atmosphere • Greenblatt et al. O4 cross section (corrected by +15% to +25%) • Single scattering albedo: 0.95 • Asymmetry parameter: 0.68 • Number of aerosol scenarios: 172480 • MLH (14): 20, 100, 200, 300, 500, 700, 1000, 1200, 1500, 1750, 2000, 2500, 3000, 5000m • OD (10): 0.05, 0.1, 0.2, 0.3, 0.5, 0.7, 1.0, 1.5, 2.0, 3.0 • f (11): 0.1, 0.2, 0.3, 0.4, 0.5, 0.7, 1.0, 1.1, 1.2, 1.5, 1.8 • for 8 elevation angles and 14 SZA / rel. Azimuth angles
1. The MPI MAX-DOAS inversion scheme Parametrisation of NO2 profiles in a similar way: A) mixing layer height MLH(important atmospheric parameter) B) fraction f of total VCD in boundary layer (allows to adjust vertical profile, depending e.g. on vertical mixing into free troposphere) However, no absolute tropospheric VCD is varied, because NO2 AMF depends only on relative profile
1. The MPI MAX-DOAS inversion scheme Aerosol inversion: Modelled AMFs are fitted to the measured data in the following way: Measurements: -Subtraction of O4 DSCD at 90° for each elevation sequence -Division by O4 VCD => O4 DAMF Model results: -Subtraction of O4 AMF at 90° for each elevation sequence => O4 DAMF Least squares fit: OD, ML (f: fixed)
1. The MPI MAX-DOAS inversion scheme Result of aerosol fit, Cabauw, 26.6. Sequence 6 Min: 0.0054 for layer height 0.5km, optical depth: 0.23
1. The MPI MAX-DOAS inversion scheme NO2 inversion: Modelled AMFs are fitted to the measured data in the following way: Measurements: - Subtraction of NO2 DSCD at 90° for each elevation sequence - Division by (shifted) DSCD at 10° Model results (calculated for specific aerosol scenario): - Subtraction of NO2 AMF at 90° for each elevation sequence => NO2 DAMF - Division by DAMFs at 10° Least squares fit: ML (f: fixed) Aerosol parameter from O4 inversion
1. The MPI MAX-DOAS inversion scheme Result of NO2 fit, Cabauw 30.6. sequence 62 30.6. sequence 59 Chi2 = 0.004 Chi2 = 0.05
2. Cloud classification Classification of the cloud cover using radiance and O4 observations at 90° elevation angle Temporal variation of radiance smooth? yes => Temporal variation of O4 smooth? yes => clear day no => cloudy day no => cloudy day O4 absorption largely increased and/or varying rapidly compared to clear day? yes => thick cloud no => thin cloud
2. Cloud classification Cabauw Bruxelles Day with clear sky 24.6.2009
2. Cloud classification Cabauw Bruxelles Day with 'thin' clouds 26.06.2009
2. Cloud classification Cabauw Bruxelles Day with 'thick' clouds 1.7.2009
2. Cloud classification Classification of the cloud cover using radiance and O4 observations at 90° elevation angle O4 AMF – O4 AMFcloudfree
3.1 Results: Aerosols A) Typical diurnal cycles B) Aerosol OD: Correlation with AERONET data C) Surface extinction: Correlation with WetNephelometer data D) Mixing Layer Height: Correlation with Ceilometer data
3.1 Results: Aerosols A) Typical diurnal cycles Clear sky cloudy
3.1 Results: Aerosols A) Typical diurnal cycles mostly cloudy Clear sky
3.1 Results: Aerosols B) Correlation with AERONET OD All coincidences (half hour averages) O4 scaling factor = 1.2 f=0.9
3.1 Results: Aerosols B) Correlation with AERONET OD Data with layer heigth >= 3km removed
3.1 Results: Aerosols B) Correlation with AERONET OD Also data with chi2 >= 0.04 removed
3.1 Results: Aerosols B) Correlation with AERONET OD Days with (unrealistic) rapid variation of the aerosol OD:
3.1 Results: Aerosols B) Correlation with AERONET OD Data with rapid variation of OD (> 0.5) removed
3.1 Results: Aerosols B) Correlation with AERONET OD Only data for thin clouds
3.1 Results: Aerosols B) Correlation with AERONET OD Only data for clear sky Coincidences only in the morning! (with systematically low MAX-DOAS results)
3.1 Results: Aerosols B) Correlation with AERONET OD Only data for thick clouds
3.1 Results: Aerosols C) Correlation with in-situ extinction Correlation with WetNephelometer data from Paul Zieger
Correlation with WetNephelometer data from Paul Zieger for different layer heights >1500m:Slope 2 <1500m Slope 1
3.1 Results: Aerosols D) Correlation with Ceilometer MLH MAX-DOAS aerosol layer height F-value: 0.9 F-value: 1.1
3.1 Results: Aerosols D) Correlation with Ceilometer MLH all data
3.1 Results: Aerosols D) Correlation with Ceilometer MLH only clear sky observations and chi2 < 0.04
3.2 Results: NO2 A) Typical diurnal cycles B) Mixing ratio: Correlation with EMPA data C) Mixing Layer Height: Correlation with Ceilometer data D) Inversion of synthetic NO2 DSCDs
3.2 Results: NO2 A) Typical diurnal cycles NO2 mixing ratio for different aerosol f-values thin clouds
3.2 Results: NO2 A) Typical diurnal cycles NO2 mixing ratio for different NO2 f-values thin clouds
3.2 Results: NO2 B) Correlation with EMPA mixing ratio All coincidences (half hour averages, f-value: 0.9)
3.2 Results: NO2 B) Correlation with EMPA mixing ratio All coincidences (half hour averages, f-value: 0.9) Chi2 < 0.04
3.2 Results: NO2 B) Correlation with EMPA mixing ratio Only thin clouds
3.2 Results: NO2 B) Correlation with EMPA mixing ratio clear sky (only early morning data)
3.2 Results: NO2 B) Correlation with EMPA mixing ratio Only thick clouds
3.2 Results: NO2 B) Correlation with EMPA mixing ratio On some days the NO2 mixing ratios depend strongly on the assumed (relative) aerosol profile. The mixing ratios derived for an elevated aerosol layer (f>1) agree better with the in-situ data. For these observations also the lowest chi2 is found in the aerosol fit (O4 data) for an assumed elevated aerosol layer
3.2 Results: NO2 B) Correlation with EMPA mixing ratio Lowest chi2 for elevated aerosol layer Better agreement of NO2 mixing ratio for elevated aerosol layer
3.2 Results: NO2 C) Correlation with Ceilometer MLH Aerosol fit: f=0.9 f=1.1
3.2 Results: NO2 D) Inversion of synthetic NO2 DSCDs Fit results for all daily profiles (UV profile 03) F-value Layer height NO2 VCD Chi2
3.2 Results: NO2 D) Inversion of synthetic NO2 DSCDs (UV profile 03, all daily profiles)
3.2 Results: NO2 D) Inversion of synthetic NO2 DSCDs Results for all UV profiles
4. Conclusions -simple MAX-DOAS inversion scheme for UV measurements, based on MC-RTM LUT and least squares fit of simple profile parametrisation -discrimination scheme for clear sky / thin clouds / thick clouds Aerosol inversion: -aerosol OD is reasonable for aerosol f-value of 0.9, clear sky and thin cloud observations; MAX-DOAS aerosol OD about 25% smaller than AERONET -aerosol extinction agrees well with wetnepelometer data for layer heights <1500m -aerosol layer height shows (weak) correlation with ceilometer data only for clear sky
4. Conclusions NO2 inversion: -NO2 mixing ratio agrees well with in-situ observations for clear sky and thin cloud observations; only weak dependence on aerosol f-value; almost no dependence on NO2 f-value -NO2 layer height shows reasonable correlation with ceilometer data for clear sky and thin cloud data Inversion of synthetic NO2 SCDs -good agreement found for NO2 profiles for low and high aerosol load -for some profiles rather large deviations during the day
3.1 Results: Aerosols B) Correlation with AERONET OD different scaling factors for the O4 cross section (observations for thin clouds) +20 % seems to be the best choice +15 % +20 % +25 %