Download
1 / 46
460 likes | 531 Views
306/7MC Research Methods. John Keenan john.keenan@coventry.ac.uk. Primary Research – original done by the researcher Secondary Research – found by the researcher from other sources. YOU DO NOT HAVE TO DO PRIMARY!. If you do...read first http://www.socialresearchmethods.net/kb/index.php

E N D
306/7MCResearch Methods John Keenan john.keenan@coventry.ac.uk
Primary Research – original done by the researcher Secondary Research – found by the researcher from other sources
If you do...read first http://www.socialresearchmethods.net/kb/index.php Books: 302.2 Media research methods Blog link for PowerPoint: http://whisperingchicken.wordpress.com/
306MC • If you choose it your likely dissertation structure will be: • Introduction – outlining dissertation (what, why, how) • Literature Review – previous studies, gap in knowledge • Methodology – how you will study topic • Results – what you found • Conclusions – connect literature review with findings
307MC No structure Present results in portfolio
Validity - does what it should Reliability - degree to which measurement is free from error
Validity Ask the right people Ask the right amount of people Ask the right questions “I like this product the best because it didn’t make my dog as sick as the previous four” http://www.googleduel.com/reportindex-popculture.php
Reliability the same results gained over re-testing Re-write the questions to test reliability eg would you drink beer out of a bucket? Is a bucket a suitable container for beer? Re-test in same way
Qualitative Research • Advantages: • does not impose reasons • gets understanding not confirmation • gains depth of knowledge • can see the world in its natural state • philosophy of the free-thinking individual • Discovers insights
Qualitative Research focus group – 8-12; recorder; moderator Interviews – depth; interview schedule; probes; record participant observation/field – record case study Systematic replicable
Why participant observation? Preliminary study Inexpensive Natural setting – Hawthorne Why not? Validity – what is recorded, one viewpoint Ethics – Covert? (if not, Hawthorne) Danger – Street Corner Society Data Cameras, sound recorders – transcribed Notepad Purpose led Give subjects cameras; complete diaries
Why focus groups Speed Interaction Why not? Monopolisation Inhibited Recording Record-transcribe Non-verbal?
Why interviews? Depth Easier Why not? Interviewer bias Recording Record-transcribe
Why case study? simple natural Why not? time consuming not generalisable Recording Record-transcribe Notes, diary
Data Discourse analysis Programs you can use: http://www.pressure.to/qda/
Sampling for qualitative research Purposive Representative
Quantitative Research Measured Advantages Provides evidence - facts and figures Can be re-tested Can be generalised Disadvantages Gives figures not reasons There are lies, damn lies and statistics 82.3% of statistics are made up on the spot
Types of quantitative research Questionnaire Survey Content analysis Experiment
population entire group of people or media about whom information is needed
Types of Sampling Convenience Quota sampling - proportion Random - eg 1 in 10 of population Snowball - contacts find contacts
Structure of Questions 1. Screen - find target audience 2. Warm-ups - easy-to-answer questions 3. Increasingly difficult questions 4. Classification (if not in 1)/personal questions
Screen Ask key questions first e.g. to get home-makers Bought a house? Got children? Eg to get earth-mothers How important is recycling to you What are the most important things about a car?
Problems to avoid How many sexual partners has your mother had? a) 5 b) 6 c) 7 d) more 1. personal 2. Leading 3. difficulty “So, Debbie, what first attracted you to the millionaire Paul Daniels?” When did you stop beating your wife? 3. Easy options Pilot it!
Classification questions gender, age, marital status, class, occupation whatever is necessary Age: Under 20 21-24 25-39 40+ Please tick Please tick Gender M F ethnicity W B A C O
Questionnaire/Survey Design Measurement Scales nominal - numbers How often do you visit the pub in a week One Two Three Four Five Six Seven likert scale - statements possibly from qualitative each item is classified beforehand eg I always send my wife to get the drinks All I want from the pub is to sit down and drink as much beer as I can
Questionnaire/Survey Design Measurement Scales graphic - pictures or line eg how comfortable are you with the idea of censorship?
Questionnaire/Survey Design rank order eg what is most important about beer - please rank - 1(most important) - 5 (least important) taste___ price___ brand___amount___ accessibility____ semantic differential scale eg how does drinking beer out of a bucket make you feel proud________________________________________________ashamed wild_________________________________________________ controlled happy _______________________________________________ sad
Methods of Data Collection street in-home place of work venue phone post internet
methods used to analyse images • semiotic analysis • content analysis • Images are not neutral • Text anchors images
population • sample • construct categories of content • establish a quantification system (coding schedule) • pilot • code • analyse data
Anchorage This is the last painting by Van Gogh before he killed himself
validity mother • synonyms for mother • referenced to female parent • referenced to term of abuse • in a child’s voice • spoken by parent
Experiments Correlation between variables Independent variable (predicts a change) dependent variable (will change) independent affects the value of dependent
Textual Analysis Methods Discourse Analysis http://bank.rug.ac.be/da/da.htm Structural analysis - Claude Levi-Strauss http://www.colorado.edu/English/ENGL2012Klages/levi-strauss.html Narrative analysis - Vladimir Propp http://social.chass.ncsu.edu/wyrick/debclass/Propp.htm Psychoanalysis - Lacan www.colorado.edu/English/ENGL2012Klages/lacan.html Semiotic Analysis Content Analysis
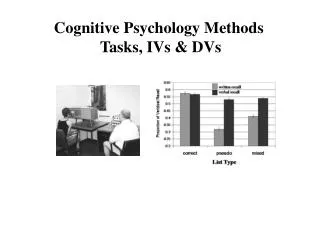
Dealing with Data • Tabulation • Average: mean, mode, median • Standard deviation • Correlation
Statistics transferred to program Excel SPSS
Percent frequency count % Significance?
Average mean - add all divide by total median - line up all responses and find the one in the middle mode - find most popular response Standard deviation square root of the variance how much the scores differ from the mean
Correlation Analysis relationship between one and the other EXCEL - CORREL