Download

1 / 11
130 likes | 315 Views
The Binomial Distributions. Section 8.1. Binomial Setting. Each observation is either a success or failure. Fixed number of trials. The n observations are independent. P(Success) = p , is the same for each observation.

E N D
The Binomial Distributions Section 8.1
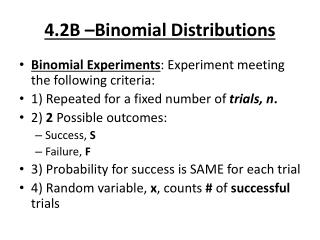
Binomial Setting • Each observation is either a success or failure. • Fixed number of trials. • The n observations are independent. • P(Success) = p, is the same for each observation. X is a discrete random variable that is the number of successes in n trials. Binomial parameters are n and p. Binomial notation: B(n,p)
Examples • Binomial Distribution? • Blood type of 5 children if parents are types A and O and the P(O in a child) is .25. • Ten cards drawn from pile. What is the number of red cards. • Two percent of cars are defective, check 20 random cars from factory. • ?
Binomial Formulas • Example: P(2 type O blood in five kids) • P(SSFFF)? • Number of ways it can happen?
Binomial Formulas • Binomial Coefficient: number of ways of getting k successes out of n observations • Combinations: nCk = = n! / k!(n-k)! • Remember 0! = 1. • P(X = k) = nCk pkq(n-k) • Example: 3% of cars are defective. Out of the 12 cars your company bought, what is the probability at most 2 are defective? n k
Binomial Probabilities on Calculator • Probability Distribution function • P(X = k): binompdf(n,p,x) • Put in list: 2nd list/ops/ seq(x,x,from,to,increment) →L1 • P(L1) = binompdf(n,p,L1) →L2 • Stat plot histogram L1, L2.
Example:10% of switches are defective, check 10. • Make a probability histogram. • Find the probability that at most 1 switch is bad.
Cumulative Distribution Function • To find P(X ≤ k) • Binomcdf (n,p,x) • Calculator: • Seq(x,x,from,to,increment) → L1 • Binompdf (n.p.x) → L2 • Binomcdf (n,p,x) → L3 • Histogram L1, L3
Simulating Binomial Experiments • Example: Free throw percentage = 75%. In 12 attempts Lauren made only 7. Is it unusual for Lauren to make at most 7 shots? • P(X ≤ 7) = binomcdf (12, .75, 7) = .1576. • Simulate: 0 = miss, 1 = hit Math / PRB / RandBin (1, .75, 12) → L1: sum L1 → L2 (1) repeat. • As repetitions increase the actual proportion of times x ≤ 7 gets closer to .1576.
Binomial Mean and Standard Deviation • Example: How many of my 65 Geometry students do you expect to fail my test, if 5% usually fail? • µ = ? • µ = np • σ = √ npq • Example: What is the expected number of defective cars from my companies 12 cars? Usually 3% are defective. What is the standard deviation?