Download
1 / 8
80 likes | 137 Views
Ensure accurate statistics calculation and data display in price tables. Adjust date formats for consistency and improve data precision.

E N D
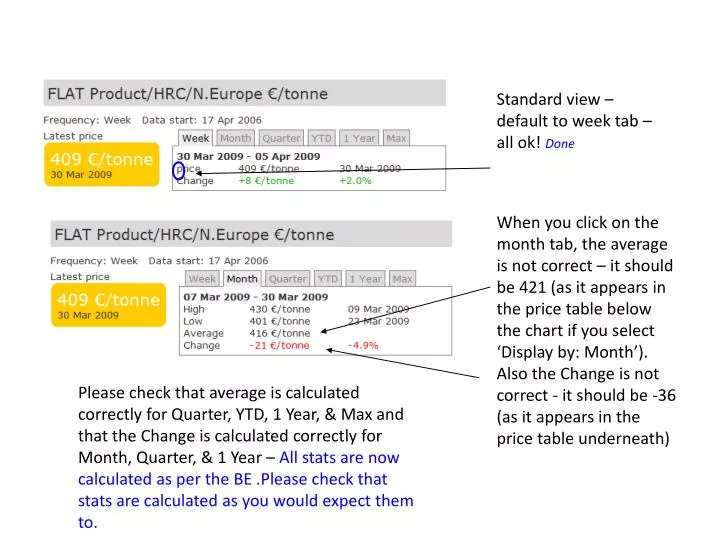
Standard view – default to week tab – all ok! Done When you click on the month tab, the average is not correct – it should be 421 (as it appears in the price table below the chart if you select ‘Display by: Month’). Also the Change is not correct - it should be -36 (as it appears in the price table underneath) Please check that average is calculated correctly for Quarter, YTD, 1 Year, & Max and that the Change is calculated correctly for Month, Quarter, & 1 Year – All stats are now calculated as per the BE .Please check that stats are calculated as you would expect them to.
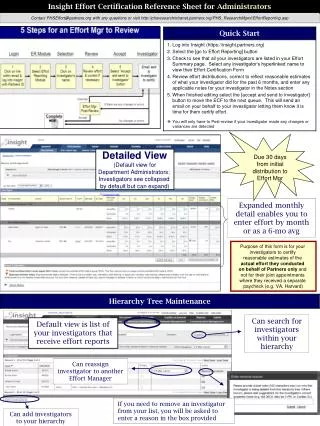
‘Data Start’ should show the first date for which there is data for the index series selected (e.g. in this case 2 Oct 2006 as indicated correctly in the Max tab) - Done
In the Price Table, the following changes are needed: If a column is full of NA, then please do not display. The last column showing should be the last date for which there is live index data – DONE Please delete the date in the title The table appears with the scroll bar at the start. Please change this to show the most recent prices (i.e. the table should be ‘right adjusted’) – I believe this works fine and we established it was only Steve’s computer.
When you change Display by to ‘Month’, there are the following problems in the price area at the top of the page: Stats should be calculated accordingly now. Let me know if you still want when changing the frequency for the tabs with the smaller period to disappear. I do not see the logic in that as the default index data which is weekly has not changed as such. • Please insert month data into the month tab • Please ensure date says March 2009, in table and yellow box (not 01 Mar 2009) • Week tab is no longer needed. Do not display this. Please ensure the tabs work in this consistent way when the view is customised to Quarter and Year as well - We did it but you loose the ability to translate the month as it is a direct PHP function that works there. We might figure out, at some point, how to do it differently but this is the case for the moment
When you change ‘Display by’ to ‘Month’: Please display the dates with just the months – e.g. Mar 09, Apr 09, May 09 (not the first day of the month 01/03/09, etc) –Changed
In the Iron Ore Price Analyser: Please make sure all price data that appears is shown to 1 decimal place (like in the Price Table for iron ore prices) - Done
There are also fixes needed on the lead time analyser: Change ‘price’ to ‘Lead time’ • Please remove currency and unit labels and replace with the label ‘weeks’ Done
There are also fixes needed on the lead time analyser: • Please ensure data in boxes at top of page and in Show Statistics box are displayed to the first decimal place - Done