Download
1 / 18
180 likes | 216 Views
Explore multiwell deconvolution methodologies in North Sea field for boundary localization with reliable algorithms. Learn from interference and short buildups for refined analysis. Study successful applications for effective reservoir management.

E N D
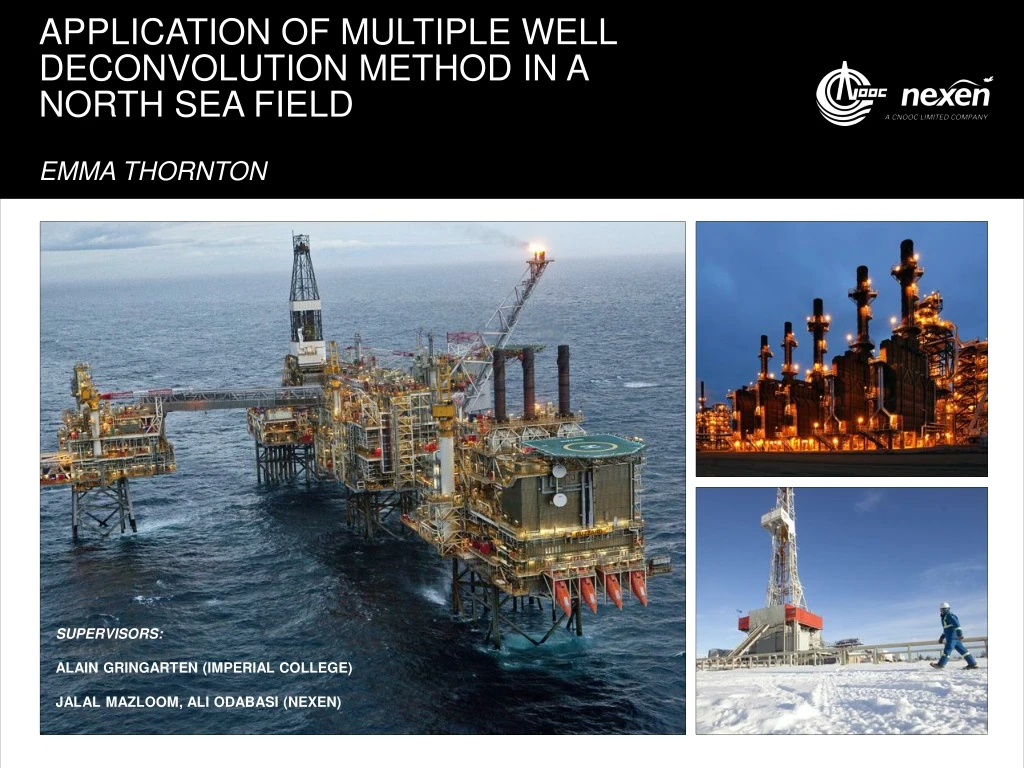
Application of Multiple well deconvolution method in a North Sea field Emma Thornton Supervisors: Alain gringarten (Imperial college) Jalal Mazloom, Ali odabasi (Nexen)
PROJECT BACKGROUND Testing group 1 ft DATA • North Sea oilfield which has just completed an initial drilling campaign. • Pre-existing well test analysis affected by: • Interference • Short buildups AIMS • Perform multiwelldeconvolution on two groups of interfering wells. • Use the results to locate boundaries. • Assess the reliability and practicality of the algorithm. Testing group 2 P15 P14 ft P13 P1 P2 P11 I1 P12 P10 N I12 N I14
Deconvolution DECONVOLUTION • Pressure drop is the convolution product of rate and reservoir response(1). SINGLE-WELL DECONVOLUTION • Multi-rate test Single drawdown of constant unit rate. • Extends the zone of investigation further into the reservoir. • Traditional deconvolution is only applicable in single-well reservoirs(2). MULTI-WELL DECONVOLUTION • Traditional deconvolution algorithm has been extended to accept multiple interfering wells(2). DECONVOLUTION von Schroeter, T., Hollaender, F., and Gringarten, A. C.: “Analysis of Well Test Data from Permanent Downhole Gauges by Deconvolution,” paper SPE 77688 presented at the 2002 SPE Annual Technical Conference and Exhibition, San Antonio, Sept 29 – Oct 2. Cumming, J. A., Wooff, D. A., Whittle, T., and Gringarten, A. C. : “Multiple Well Deconvolution,” paper SPE 166458 presented at the 2013 SPE Annual Technical Conference, Sept 30 – Oct 2.
Methodology Define which wells are in the interfering group. Filter pressure data for each well to between 5 and 25 points per log cycle. Normalise pressures to a common depth. DATA PREPARATION Pressures and rates for each well are input into the deconvolution algorithm. The algorithm outputs a deconvolved derivative for each well which reflects only the geology of the surrounding reservoir – interference effects have been removed. MULTIWELL DECONVOLUTION An interference pressure drop and deconvolved derivative is also output for every pair of wells in the deconvolution. Load the convolved pressure drop into a pressure transient analysis software and apply a unit rate. ANALYSING DECONVOLVED RESULTS Analyse for boundary effects as usual. Apply boundary model obtained from deconvolution to regular well test analysis to determine k, skin
Methodology Define which wells are in the interfering group. Filter pressure data for each well to between 5 and 25 points per log cycle. Normalise pressures to a common depth. DATA PREPARATION Pressures and rates for each well are input into the deconvolution algorithm. The algorithm outputs a deconvolved derivative for each well which reflects only the geology of the surrounding reservoir – interference effects have been removed. MULTIWELL DECONVOLUTION An interference pressure drop and deconvolved derivative is also output for every pair of wells in the deconvolution. Load the convolved pressure drop into a pressure transient analysis software and apply a unit rate. ANALYSING DECONVOLVED RESULTS Analyse for boundary effects as usual. Apply boundary model obtained from deconvolution to regular well test analysis to determine k, skin
Testing Group 1 • Two producers and one injector. • Deconvolutions were run with all 3 wells included in the algorithm. • Additional deconvolutionswere run with wells ignored from the algorithm. N P1 P2 I1
Results from Testing Group 1 • Limited communication between P1/P2. • In agreement with independent reservoir simulation models. ft --- The P1 deconvolution with only I1 interference removed. --- The P1 deconvolutionwith I1 and P2 interference removed. --- The P1 deconvolution with no interference removed. --- The P1 deconvolution with only P2 interference removed. N Interference pressure drop between P1/P2 is always less than between P1/I1 P1 P2 I1
Results from Testing Group 1 Convolved pressure Deconvolvedderivative Pressure drop from model Derivative from model • Final deconvolution results for wells P1, P2 and I1. • Boundaries initially modelled from faults observed in seismic. • Leakage adjusted/Extra baffles to flow added. • In agreement with reservoir fluid models of the region P (psi) P1: 0.1 0.01 1e-3 ft 1e-4 10 T(hr) 0.01 0.1 1 1000 100 10000 P (psi) P2: 0.1 0.01 1e-3 1e-4 T(hr) 0.01 0.1 1 10 1000 100 10000 P (psi) I1: 0.1 0.01 1e-3 1e-4 10 T(hr) 0.01 0.1 1 1000 100 10000
Results from Testing Group 1 Convolved pressure Deconvolvedderivative Pressure drop from model Derivative from model • Final deconvolution results for wells P1, P2 and I1. • Boundaries initially modelled from faults observed in seismic. • Leakage adjusted/Extra baffles to flow added. • In agreement with reservoir fluid models of the region P (psi) P1: 0.1 0.01 1e-3 ft 1e-4 10 T(hr) 0.01 0.1 1 1000 100 10000 P (psi) P2: 0.1 0.01 1e-3 1e-4 T(hr) 0.01 0.1 1 10 1000 100 10000 P (psi) I1: 0.1 0.01 1e-3 1e-4 10 T(hr) 0.01 0.1 1 1000 100 10000
Testing Group 2 ft • Six interfering producers and two injectors. • Well P13 was the focus of this Testing Group • Groups of wells were deconvolved with P13 N P15 P14 P13 I12 P11 I14 P12 P10
Results from Testing group 2 ft • Uncertainty over fault between P11 and P13 • Interference effect only significant after 500 hours • Implies fault leakage is minimal. N P15 P14 P13 I12 P11 I14 • Next Step: Wells were added to the deconvolution group one-by-one. P12 P10
Results from NORTHERN Testing group ft • Boundaries of the system were initially modelled from faults observed in seismic. • Leakage of faults was adjusted. Convolved pressure Deconvolvedderivative Pressure drop from model Derivative from model N P13 P (psi) 0.1 P15 P14 0.01 1e-3 P13 I12 0.01 0.1 1 1000 100 10000 T(hr) 10 P11 I14 Interference response for P13/P10 P12 P10
Results from NORTHERN Testing group ft • Boundaries of the system were initially modelled from faults observed in seismic. • Leakage of faults was adjusted. Convolved pressure Deconvolvedderivative Pressure drop from model Derivative from model N P13 P (psi) 0.1 P15 P14 0.01 1e-3 P13 I12 0.01 0.1 1 1000 100 10000 T(hr) 10 P11 I14 Interference response for P13/P10 Interference response for P13/P10 P12 P10
Benefit of multiwelldeconvolution • Regular well test analysis provides limited information • Deconvolution extends the zone of investigation • Single-well deconvolutioncan be distorted by interference. • Only through multiwelldeconvolutionis it possible to obtain a reliable derivative which represents the geological characteristics. Multi-well Normal well test analysis Single-well
DISCUSSION of ALGORITHM P13 single-well deconvolution RELIABILITY • The multiwell algorithm was used to perform single-well deconvolution. • Result was compared to the Total Least Squares Deconvolution tool. • Confirmed that the deconvolutions calculated using the new algorithm were consistent ALGORITHM RUN-TIMES • Typical deconvolutions were carried out.
Conclusions MULTIWELL DECONVOLUTION • Multiwelldeconvolution has the capability of extending the benefits of deconvolution to producing fields. • Results have been consistent with other reservoir engineering studies. INTERFERENCE • Conclusions can be drawn about well interference. • Interference responses can be interpreted. PRACTICALITY OF USE • Run-times of the algorithm are reasonable.
ACKNOWLEDGEMENTS I wish to extend thanks to Nexen CNOOC for supplying the data for this project and for providing financial support throughout the project and for accommodating me in their Uxbridge offices. I also would like to thank Jonathan Cumming of Durham University for his help and support with the coding of the algorithm. Finally, I thank my supervisors Jalal Mazloom and Ali Odabasi of Nexen CNOOC and Alain Gringarten in Imperial College for all their excellent technical expertise over the duration of the project, and Jon Wardell for welcoming me into his team for the summer.