Download

1 / 28
280 likes | 306 Views
Explore time-series analysis and forecasting techniques in finance focusing on Consumer Price Index (CPI) trends. Learn about regression models, seasonal effects, smoothing techniques, and forecasting methods for predicting CPI trends.

E N D
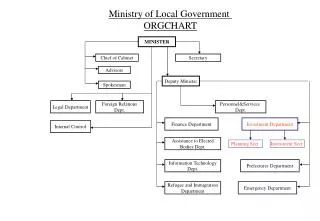
What will be the next year U/E, CPI..??? MinisterofFinance
Overview • Recall Regression Model X: independent variable Y: dependent variable • Time-series: • Definition: Variable measured over time in sequential order • Independent variable: Time
Overview Example:
Components + Long-term trend: Smooth pattern with duration > 1 year
Components + Cyclical effect: wavelike pattern about a long-term trend, duration > 1 year, usually irregular Cyclesaresequencesofpointsabove & belowthe trendline Volume Time
Components + Seasonal effect: like cycles but short repetitive periods, duration < 1 year (days, weeks, months…) Sales peak in Dec.
Components + Random variation: irregular changes that we want to remove to detect other components Random variation that does not repeat Volume Time
Smoothing techniques • Purpose: Remove random fluctuation to detect seasonal pattern • 2 types: • Moving average (MA) • Exponential smoothing
Smoothing techniques Example of Moving average:
Time-series forecasting with regression • Forecast of trend & seasonality: Ft = [ β0 + β1t ] SIt where: Ft = forecast for period t SIt = seasonal index for period t
Using the following data about CPI of Viet Nam from 2005 to 2008 for forecasting CPI in 2010: Application
Application • Reasons: • CPI is measured over time (monthly) • 3 components exist Technique: Time-series forecasting with regression
Application Random variation in 2008 CPI peaks in Feb
Application • Trend analysis Using Excel, the trend line is: yt = 100.551 + 0.016 t y = 100.551 + 0.016 t
Application • Seasonal index • Apply the formula: Ft = [ β0 + β1t ] SIt
Application • Forecast CPI in 2008 Forecast CPI of 2008 did not match actual CPI due to unexpected events (recession)
Application • Forecast CPI in 2010
Forecasting results y = 100.551 + 0.016 t Forecasted CPI - Long term trend:slightincreaseinCPI -Seasonal effect: peak inFeb.
References • ‘Time Series Analysis’, Citing or referencing electronic sources of information, viewed 15 May 2010, http://www.statsoft.com/textbook/time-series-analysis/?button=3 • Australian Bureau of Statistics, ‘Time Series Analysis: The Basics’, viewed 15 May 2010, http://www.abs.gov.au/websitedbs/d3310114.nsf/4a256353001af3ed4b2562bb00121564/b81ecff00cd36415ca256ce10017de2f!OpenDocument#WHAT%20IS%20A%20TIME%20SERIES%3F • ‘Introduction to Time Series Analysis’, Citing or referencing electronic sources of information, viewed 15 May 2010, http://www.itl.nist.gov/div898/handbook/pmc/section4/pmc4.htm • Berenson, M. & Levine, D. 1998, Business Statistics - A first course, Prentice Hall Press. • Anderson, D., Sweeney, D. & Williams, T. 1999, Statistics for business and economics, South-Western College Publishing, Ohio. • Selvanathan, A., Selvanathan, S., Keller, G. & Warrack, B. 2004, Australian business statistics, Nelson Australia Pty Limited.