Download
1 / 18
180 likes | 196 Views
This study analyzes the performance of web server proxies placement using numerical examples and simulation setups. It compares algorithms, traffic reduction ratios, and discusses optimal proxy placement strategies based on access frequency, hit ratio, and read-write operations.

E N D
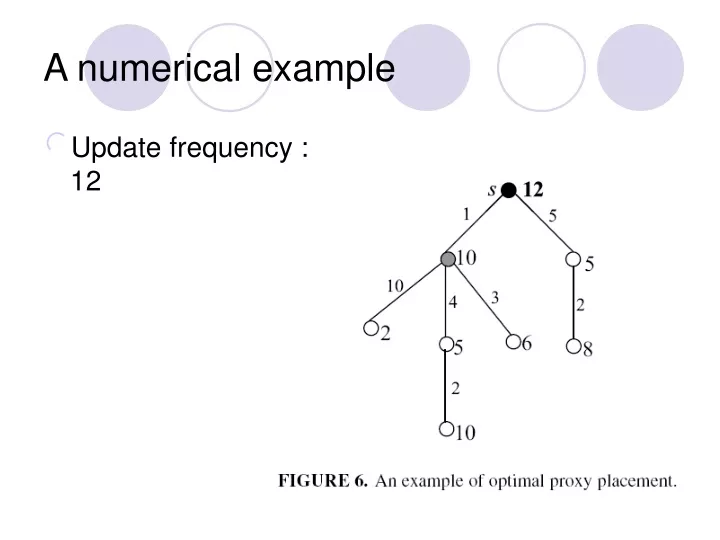
A numerical example • Update frequency : 12
Simulation Setup • Inet topology generator, • http://topology.eecs.umich.edu/inet/ • Default n = 3037 • r(v) randomly generated in [0,100] • w : number of update operation • α : read-write ratio
Performance comparisons • Traffic reduction ratio • 3 algorithm: • Greedy • Optimal • random
Performance comparisons (R vs. k) • α = 0 • Difference between opt and greedy usually within 10% • R rises sharply at a small number of proxies • R does not change much as the access frequency changes.
Performance comparisons (Bell Lab) • Why different? • Traffic even or uneven
Performance comparisons (R vs. k ) • ρ (hit ratio) : fixed 40%
Performance comparisons (R vs. α) • ρ (hit ratio) : fixed 40%
Observation • Randomly placing the proxy just makes the things worse. • R increases sharply when k is small and becomes saturated when k reaches about 5. • Placing too many proxies would degenerate the system performance • If the update frequency is relatively high.
Performance comparisons ( R vs. ρ) • R improves significantly as ρ increases
Finding the optimal number of proxies • Depends on n, α and ρ • For the next 3 figures, 2 y-axis are used: • LHS : the optimal number of proxies required in the system (denoted by k) • RHS : the corresponding traffic reduction ratio (denoted by R)
The optimal number of proxies ( diff. n ) • ρ = 40% • α = 0.001 and 0.0001 • k-curve for α= 0.001 remains almost flat • The k-curve for α= 0.0001 shows a stable increase • Two R-curves are quite flat
The optimal number of proxies (diff. α) • ρ = 40% • the need of proxies drops dramatically as the update to the Web data frequency increases. • We could predict k-curve would eventually reach 0.
The optimal number of proxies (diff. ρ) • The k-curve and R-curve both show a stable increase of k as the hit-ratio increases • Placing more proxies should come together with the improvement of cache hit-ratio
Discussion • Stability of routing • If routes are stable, the routes used to access the Web server would form a SPT; root=server. • In reality: • 80% of routes change less often than 1/day • 93% of the routes are actually stable (from Bell Lab’s Web server to 13,533 destinations ) • Reduce the arbitrary network to a tree
Discussion (cont.) • The placement of en-route proxies in the routers requires static configuration work. • although the client population changes significantly from time to time, the outgoing traffic remains pretty stable. • the optimal locations for the proxies do not change by much as time progresses
Discussion (cont.) • Multicast model and not considering building and maintenance cost. • Once a proxy is placed at node u, the nodes on the π(u, s) path can have a proxy without increasing the cost, but just decrease read cost on those nodes. • Solution : Consider the monetary cost and maintenance cost.
Conclusion • placing k proxies problem • Time complexity : O(n3k2), where k is the number of proxies and n the number of nodes in the system. • The optimal number of proxies problem • given the read frequencies of all clients and the update frequency of the server. • Time complexity : O(n3),
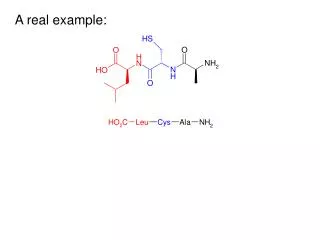
Web-Server Proxies Placement of with Consideration of 2007 COMMUNICATION OPTIMIZATION FOR PARALLEL PROCESSING Read 李苡嬋 and Update Operations 張又仁 the 莊謹譽 on Internet