Download
1 / 37
370 likes | 384 Views
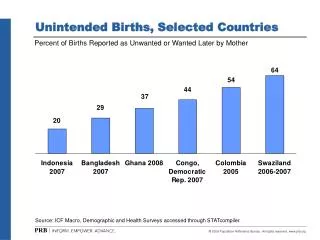
This report provides an overview of birth trends in Massachusetts from 2000 to 2010, highlighting changing demographics, diversity, and selected topics such as preterm birth, smoking during pregnancy, gestational diabetes, and cesarean deliveries.

E N D
Massachusetts Births 2010 Massachusetts Department of Public Health Bureau of Health Information, Statistics, Research, and Evaluation Division of Research and Epidemiology Registry of Vital Records & Statistics Bureau of Family Health and Nutrition March 2013
Topics • Overview and trends • Changing demographics • Diversity and disparities • Selected Topics • Preterm and Low Birthweight • Smoking during pregnancy • Gestational Diabetes • Cesarean Deliveries • Adequacy of Prenatal Care • Summary
Massachusetts Birth Indicators Since 2000 2000 and 2010 * Statistically Significant(p≤.05)
Massachusetts Birth Indicators – One Year 2009 and 2010 * Statistically Significant(p≤.05)
2 A Comparison of 2010 Massachusetts Birth Indicatorswith US1 Data 1. Births: Final Data for 2010, National Vital Statistics Reports, Volume 61, Number 1, August 2012. 2. Provisional estimates for 2010 US, National Vital Statistics Reports- Volume 60, Number 4, January, 2012. *Statistically Significant difference with US (p ≤ .05)
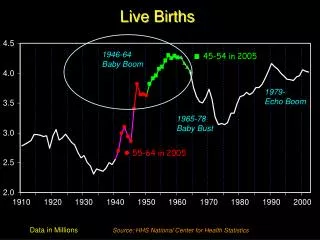
-2.2%* APC -0.8%* APC -2.4% APC Trend in the Number of Births Massachusetts: 1990-2010 92,461 * Statistically Significant(p ≤.05) APC = Annual Percentage Change
-2.2%* APC -1.9%* APC 2007 +0.3%* APC 1995 Fertility Birth Rate(per 1,000 females ages 15-44 years)Massachusetts: 1990-2010 * Statistically Significant(p ≤.05) APC = Annual Percentage Change
MassachusettsBirths by Race and Hispanic Ethnicity: 2000 Other Groups 26% White, Black, Asian, and Other are Non-Hispanic Massachusetts 200081,582 Births
MassachusettsBirths by Race and Hispanic Ethnicity: 2010 Other Groups 33% White, Black, Asian, and Other are Non-Hispanic Massachusetts 201072,835 Births
0.6% APC 5.5%* APC 1.1% APC Percent Foreign Born Mothers Massachusetts: 1990-2010 * Statistically Significant(p ≤.05) APC = Annual Percentage Change
+1.9%* APC -2.0%* APC Number of Births by Mother’s Age Massachusetts: 1990-2010 -5.4%* APC -1.8%* APC -3.1%* APC * Statistically Significant(p ≤.05) APC = Annual Percentage Change
-0.9% APC 5.4%* APC Percent Multiple Births Massachusetts: 1990-2010 2002 *Statistically Significant(p ≤.05) APC = Annual Percentage Change
Teen Birth Rates Massachusetts and US : 1990-2010
Teen Birth Rates by Race1 and Ethnicity Massachusetts: 1990-2010 1 non-Hispanic
Teen Birth Rates Ranked by Teen Rate(Among Communities with Highest # of Teen Births in 2010) ** Statistically lower (p ≤.05)
-5.3%* APC -0.6% APC Infant Mortality Rate (IMR)Massachusetts: 1990-2010 1996 * Statistically Significant(p ≤.05) APC = Annual Percentage Change
IMR by Race1 & Hispanic Ethnicity Massachusetts: 1990-2010 1 non-Hispanic
IMR by Race1 & Hispanic Ethnicity Massachusetts: 1990-2010 -2.1%* APC -2.2%* APC 1 non-Hispanic * Statistically Significant(p ≤.05) APC = Annual Percentage Change
- 7.8%* APC 1996 Hispanic IMR Massachusetts: 1990-2010 1.0% APC * Statistically Significant(p ≤.05) APC = Annual Percentage Change
Highest Infant Mortality Rates Among the 30 Largest Communities in Massachusetts: 2010 Rate = infant deaths per 1,000 live births * Statistically Significantlyhigher than state rate (p ≤.05)
Highest Infant Mortality Rates Among the 30 Largest Communities in Massachusetts: 2008-2010 Rate = infant deaths per 1,000 live births * Statistically Significantlyhigher than the state rate (p ≤.05)
Birth Characteristics by Maternal Education Massachusetts: 2010 **All indicators are significantly different for the two groups.
- 9.6%*APC Smoking During Pregnancy Massachusetts: 1990-2010 - 6.2%*APC - 2.4%*APC * Statistically Significant(p ≤.05) APC = Annual Percentage Change
-0.9% APC +3.4%* APC +3.8%* APC -0.4% APC +2.1%* APC Low Birthweight and Preterm Massachusetts: 1990-2010 Low birthweight: less than 2,500 grams or 5.5 pounds. Preterm: < 37 weeks gestation. * Statistically Significant(p ≤.05) APC = Annual Percentage Change
Adequate Prenatal Care1 Massachusetts: 1990-2010 +0.2%*APC 1 Based on Adequacy of Prenatal Care Utilization (APNCU) Index. * Statistically Significant(p ≤.05) APC = Annual Percentage Change
Gestational Diabetes Mellitus (GDM) Massachusetts: 2000-2010 +5.1%*APC * Statistically Significant(p ≤.05) APC = Annual Percentage Change
Cesarean DeliveriesMassachusetts and the US: 1990-2010 * Statistically Significant(p ≤.05) APC = Annual Percentage Change
4.5%*APC -0.1%APC - 2.1%*APC 7.0%*APC Cesarean DeliveriesMassachusetts: 1990-2010 * Statistically Significant(p ≤.05) APC = Annual Percentage Change
Summary • Most Massachusetts perinatal health indicators are better than those of the US • The teen birth rate is at an all time low • Smoking during pregnancy is at an all time low • Breastfeeding and Adequate Prenatal care reached record highs • One-third of all births are to non-white mothers • Cesarean delivery rate remains stable: one-third of all births are delivered by Cesarean section
Disparities Persist by Race, Ethnicity Geography, and SES • The infant mortality rate (IMR) for Blacks is more than twice as high as the IMR for Whites • The Hispanic teen birth rate is almost 5 times that of Whites • Less educated mothers have poorer birth indicators than more educated mothers • Mothers with their prenatal care paid through Medicaid/MassHealth were almost 6 times more likely to report smoking during pregnancy than those with their prenatal care paid by private sources
How to Access the BirthsReport and Data • To access hard copies of the 2010 Report, call • Voice: (617) 740-2670 • TDD/TTY: (617) 624-6001 • DPH Website: • http://www.mass.gov/eohhs/docs/dph/research-epi/birth-report-2010.pdf • To access Birth data via MassCHIP (DPH’s Internet- based public health information service) • Website: http://masschip.state.ma.us • Telephone: 1-888-MASCHIP (Mass only) • (617) 624-5629 • New blog called Commonwealth Conversations: Public Health at http://publichealth.blog.state.ma.us