Download
1 / 28
280 likes | 294 Views
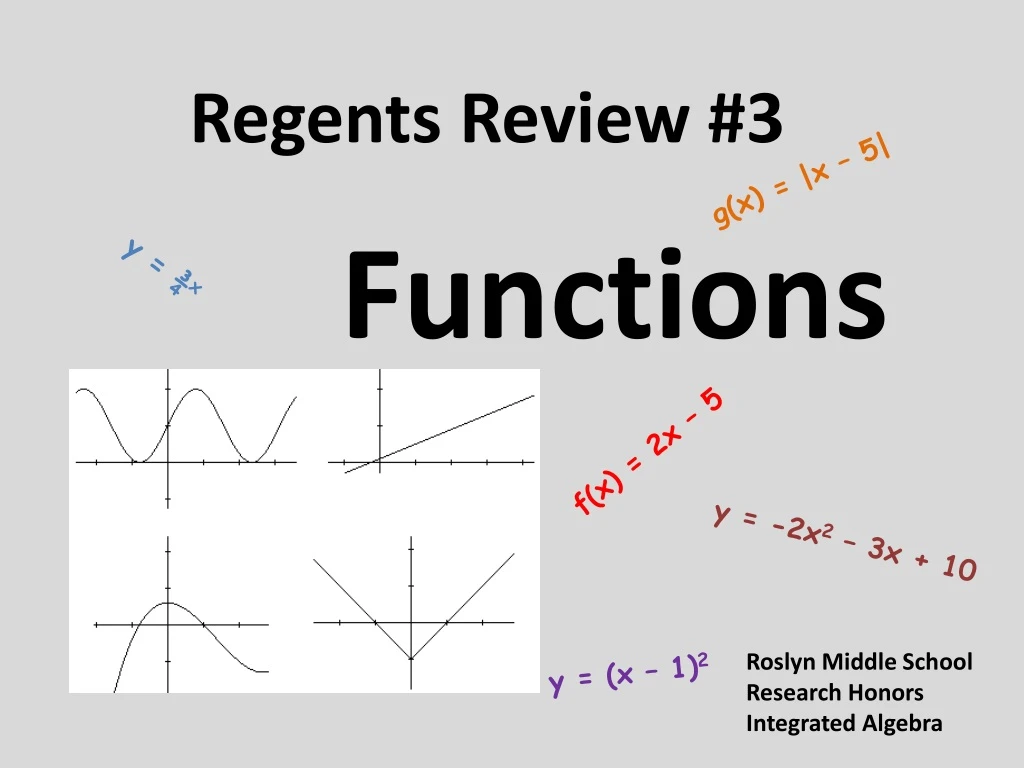
g(x) = |x – 5|. Regents Review #3. y = ¾ x. f(x) = 2x – 5. Functions. y = -2x 2 – 3x + 10. Roslyn Middle School Research Honors Integrated Algebra. y = (x – 1) 2. Functions. Which relation represents a Function?. What is a function?

E N D
g(x) = |x – 5| Regents Review #3 y = ¾x f(x) = 2x – 5 Functions y = -2x2 – 3x + 10 Roslyn Middle School Research Honors Integrated Algebra y = (x – 1)2
Functions Which relation represents a Function? What is a function? A relation in which every x-value(input) is assigned to exactly one y-value (output) Function Not a Function
Functions Which graph represents a function? We can recognize functions using the vertical line test Vertical Line Test: If a graph intersects a vertical line in more than one place, the graph is not a function Function Not a function
Functions Functions can be written using function notation “f(x)” means f of x Example: f(x) = 2x – 3 means the same as y = 2x – 3 g(x) = 2x – 3 means the same as y = 2x – 3 h(x) = 2x – 3 means the same as y = 2x – 3
Functions In this course, we explored four different Function Families • Linear Functions • Quadratic Functions • Exponential Functions • Absolute Value Functions
Linear Functions Linear Functions “y = mx +b” The best ways to graph a linear function are… • Table of Values • Slope-Intercept Method (most effective)
Linear Functions Table of Values Method Graph 2x – 4y = 12 y = ½ x – 3 2x – 4y = 12
Linear Functions Before we discuss the Slope-Intercept Method, let’s discuss SLOPE Slope is a ratio: Slope Formula = 0 slope Undefined slope Parallel Lines have the same slope Positive Slope Perpendicular lines have opposite, reciprocal slopes Negative Slope
Linear Functions Slope-intercept Method y = mx + b m = slope b = y –intercept (0,b) Graph 6x + 3y = 9 y = -2x + 3 m = b = 3 (0, 3) 6x + 3y = 9
Linear Functions Vertical Lines x = a where a represents the x-intercept x = 4 Horizontal Lines y = b where b represents the y-intercept y = 4 y = 4 x = 4
Linear Functions Writing the Equation of a Line Write the equation of a line that runs through the points (-3,1) and (0,-1) Find the slope (m) (-3,1) (0,-1) Find the y-intercept (b) y = mx + b 1 = (-2/3)(-3) + b 1 = 2 + b -1 = b Write the equation in “y = mx + b” y = x – 1 b = -1 m = -2/3
Linear Functions Write the equation of a line that is parallel to y – 2x = 4 and runs through the point (-2,4) Find the slope Parallel lines have the same slope y – 2x = 4 y = 2x + 4 m = 2 Find the y-intercept y = mx + b 4 = 2(-2) + b 4 = -4 + b 8 = b b = 8 Write the equation in “y = mx + b” y = 2x + 8
Quadratic Functions Quadratic Functions “y = ax2 + bx + c” How do we graph quadratic functions? • Find the coordinates of the vertex • Create a table of values • Graph a parabola • Label the graph with the quadratic equation
Quadratic Functions Graph f(x) = x2 + 4x – 12 f(x) = x2 + 4x – 12 means y = x2 + 4x – 12 Finding the y-coordinate y = x2 + 4x – 12 y = (-2)2 + 4(-2) – 12 y = 4 – 8 – 12 y = -16 Vertex = (-2, -16) Finding the coordinates of the vertex Finding the x-coordinate y = x2 + 4x – 12 a = 1, b = 4, c = -12 x = x = x = -2
Quadratic Functions Vertex (-2,-16) x-intercept (-6,0) x-intercept (2,0) f(x) = x2 + 4x – 12 Axis of Symmetry x = -2
Quadratic Functions The x-intercepts of the graph of a quadratic function are also known as the “roots”. We can identify the “roots” of a quadratic function by looking at the graph of a parabola and locating the x-intercepts. We can also identify the roots algebraically.
Quadratic Functions Finding “roots” algebraically Let’s look at our previous example y = x2 + 4x – 12 In order to find the “roots” (x-intercepts), set y = to zero y = x2 + 4x – 12 0 = x2 + 4x – 12 0 = (x + 6)(x – 2) 0 = x + 6 0 = x – 2 -6 = x 2 = x The roots of the function are (0,-6) and (0,2)
Quadratic Functions How does a affect the graph of y = ax2 + bx + c ? If the coefficient of x2 gets larger, the parabola becomes narrower If the coefficient of x2 gets smaller, the parabola becomes wider If the coefficient of x2 is negative, the parabola opens downward
Quadratic Functions How does c affect the graph of y = ax2 + bx + c ? y = x2 y = x2 + 5 y = x2 – 5 “c” represents the y-intercept and moves the parabola up and down.
Exponential Functions There are two types of Exponential Functions • Exponential Growth y = abx where b > 1 • Exponential Decay y = abx where 0 < b < 1
Plots: Exponential Functions y = 2x y = ½ x
Exponential Functions Properties of Exponential Functions What happens to y = 2x when…. 5 is added multiplied by -1 • y = 2x + 5 2) y = -2x
Exponential Functions Exponential Growth Formula y = a(1 + r)t The cost of maintenance on an automobile increases each year by 8%. If Alberto paid $400 this year for maintenance for his car, what will the cost be (to the nearest dollar) seven years from now? y = a(1 + r)t y = 400(1 + .08)7 y = 400(1.08)7 y = 685.5297… The cost will be $686.00
Exponential Functions Exponential Decay Formula y = a(1 – r)t A used car was purchased in July 1999 for $12,900. If the car loses 14% of its value each year, what was the value of the car (to the nearest penny) in July 2003? y = a(1 – r)t y = 12,900(1 – .14)4 y = 12,900(.86)4 y = 7056.4052… The cost of the car was $7056.41
Absolute Value Functions Absolute Value Functions “y = |x|” • How do you an input an absolute value function into a graphing calculator? • Y = • Matharrow over to NUM • #1abs( • Input x • Graph
Absolute Value Functions Properties of Absolute Value Functions What happens to y = |x| when…. 5 is addedmultiplied by -1 • y = |x| + 5 2) y = -|x|
Absolute Value Functions Properties of Absolute Value Functions What happens to y = |x| when a number other than 1 is multiplied by x? As the coefficient of x gets larger, the graph becomes thinner As the coefficient of x gets smaller, the graph becomes wider
Regents Review #3Now it’s time to study!Using the information from this power point and your review packet, complete the practice problems.