Download

1 / 26
280 likes | 543 Views
Non-parametric Tests e.g., Chi-Square. Parametric Interval or ratio data Name parametric tests we covered Tuesday. Non-parametric Ordinal and nominal data. When to use various statistics. Parametric Tests. To compare two groups on Mean Scores use t-test.

E N D
Parametric Interval or ratio data Name parametric tests we covered Tuesday Non-parametric Ordinal and nominal data When to use various statistics
Parametric Tests To compare two groups on Mean Scores use t-test. For more than 2 groups use Analysis of Variance (ANOVA) Nonparametric Tests Can’t get a mean from nominal or ordinal data. Chi Square tests the difference in Frequency Distributions of two or more groups.
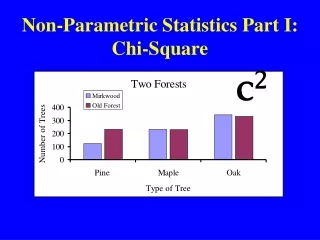
Chi-Square X2 • Chi Square tests the difference in frequency distributions of two or more groups. • Test of Significance • of two nominal variables or • of a nominal variable & an ordinal variable • Used with a cross tabulation table
2 Chi-Square Chi-Square =
Logic of Chi-Square Analysis • If the observed values are different enough from the expected values, you reject the null hypothesis • If the observed values and the expected values are similar, you fail to reject the null hypothesis
Example: Work & Pregnancy • The impact of working on pregnancy • Ha: Working during pregnancy increases the risk of miscarriage • H0: Working during pregnancy has NO impact on the risk of miscarriage
Example: Work & Pregnancy • Suppose in general population 5 in 100 pregnancy results in miscarriage • Probability(p) = .05 or 5%
Total (n=1000) Yes 50 (5%) No 950 (95%) Total 1000 Example: Work & Pregnancy Miscarriage
Work (n=500) No Work (n=500) Total (n=1000) Yes 50 (5%) No 950 (95%) Total 500 500 100 Example: Work & Pregnancy • H0: Working during pregnancy has NO impact on the risk of miscarriage ? Miscarriage
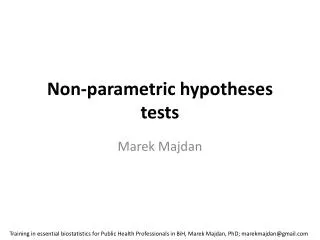
Work (n=500) No Work (n=500) Total (n=1000) Yes Miscarriage 25 (5%) 25 (5%) 50 (5%) No 475 (95%) 475 (95%) 950 (95%) Total 500 500 100 Example:Work & Pregnancy • If NULL hypothesis TRUE, both work & no work groups would have same probability of miscarriage. EXPECTED values: Miscarriage
Work (n=500) No Work (n=500) Total (n=1000) Yes Miscarriage 40 (8%) 10 (2%) 50 (5%) No 460 (92%) 490 (98%) 950 (95%) Total 500 500 100 Example:Work & Pregnancy • The actual values in your data = OBSERVED VALUES Miscarriage
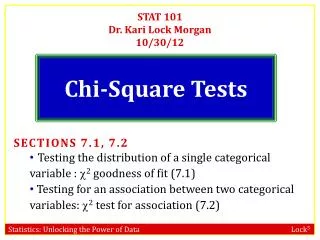
Tourist Expenditure: Mainlander vs. Japanese Chi-Square x2= 7.34, df = 2, p<.001
Use SPSS Crosstabs (for nominal and ordinal data) • Click…. Analyze • Descriptive statistics • Crosstabs • Highlight variables for row • Highlight variable for column • Click statistics, click chi-square or correlation • Etc.
Both chi square(non-parametric test) and t-test(parametric test)… • Examines if observed difference between groups in your data is true difference • True difference = difference that exists in the population • H0 says there is no difference in the population
Which values are compared? Chi-Square Frequencies in each cell t-test Mean and Standard Deviation of each group
If H0 is true… Chi-Square The values in the frequency table will look like Expected Values t-test The distribution of both groups will look like Population Distribution
Male Female Total YES 30% 30% 30% NO 70% 70% 70% Chi- square: If H0 is true…Males = Females (No difference)
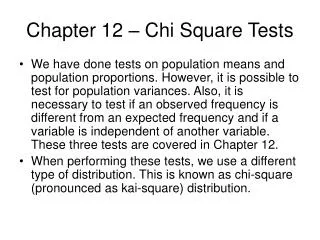
Total Female Male t-test: If H0 is true … # of cases Test score Mean
Total Female Male t-test: If H0 is NOT true … # of cases Test score Mean Mean Mean
Total Female Male t-test:If H0 is NOT true … # of cases Test score Mean Mean