Download
1 / 31
320 likes | 422 Views
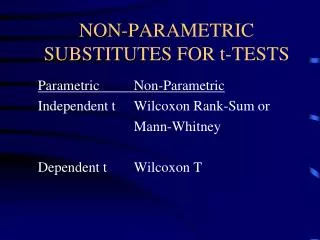
Tables and Non Parametric Tests. Lecture 5. Compare Means Menu. Compare Means Output. ”Service package”. ”Important package”. But What if Data are NOT Normal?. Non-normal Data. Binomial data. Really non-normal data. Log-normal data. Transform Data.

E N D
Tables and Non Parametric Tests Lecture 5
Compare Means Output ”Service package” ”Important package”
But What if Data are NOT Normal?
Non-normal Data Binomial data Really non-normal data Log-normal data Transform Data Compare the means of the transformed (normal) data
Binomial Data Are the proportions of Turks in Aalborg and Århus the same?
Are the proportions significantly different? 7.0% 10.5% Compare 3.5% (= 10.5 – 7.0%) withsuitable SE.
Another Approach Observed Expected In total 77 turks in a 900 sample, i.e. 8.6% We expect 34 turks in Århus (8.6% of 400)
Same proportion in Aalborg and Århus? Observed Expected Observed and expected should be close
How to do it in SPSS …or data could be organized in 900 rows
Output Expected values Proportions Test Statistic P-value
Binomial One-Sample Two-Sample K-Sample Is proportion equal to 10% Proportions in Aalborg and Århus are equal Proportions in Aalborg, Randers, Vester Hjermislev and Århus are equal • Calculate proportion and 95% CI • Is 10% in the CI? Cross-Tabs handles two or more cities (categories) …or use SPSS as I will show later
Non-Normal Data Observations Ranks
Statistics on Ranks Mean Ranks should be close if the two distributions are located similarly 8.6 12.4
Output Mann-Whitney Test ”Service package” ”Interesting package” ”Important package”
One-Sample (Symmetry or Location) Normal distributed ? • Kiama Blowhole Data • Highly skew distribution • Average approx 40 sec • Rarely above 100 sec Median equal to 40 sec? Only above 100 sec in 1% of the eruptions?
Output But QQ-plots are better!! Data are Not Normal Not Uniform
Location of median Median equal to 40 sec? Only above 100 sec in 1% of the eruptions?
Output NPar Tests Median equal to 40 sec? NOPE!
Output ”Service package” Kruskal-Wallis Test ”Important package”
Overview (normal samples) One sample Two samples (unpaired) Two samples (paired) K samples
Overview (binomial samples) One sample Two samples (paired) Two samples (unpaired) K samples
Overview (non normal samples) One sample Two samples (paired) Two samples (unpaired) K samples