Download
1 / 14
170 likes | 399 Views
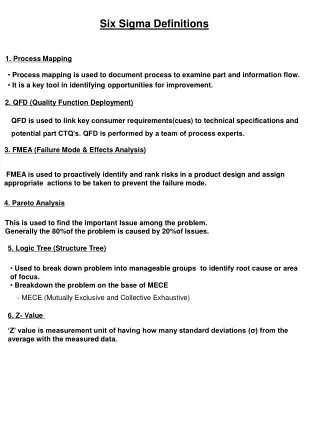
Simple Process Mapping Techniques. Why Process Mapping?. Process mapping: Visually represents the work process Identifies problem areas and opportunities for process improvement Provides a common understanding of the entire process and specific roles and contributions of process participants.

E N D
Why Process Mapping? • Process mapping: • Visually represents the work process • Identifies problem areas and opportunities for process improvement • Provides a common understanding of the entire process and specific roles and contributions of process participants. • Before you can improve a process, you must understand it. • Process maps are good for: • Streamlining work activities and telling new people, as well as internal and external customers, "what we do around here." • Helping in the effort to reduce cycle time, avoid rework, eliminate some inspections or quality control steps, and prevent errors. • Process maps are a great problem solving tool • Helps us determine what is the problem/what it is not
What is a Process? A process converts inputs into outputs
How to Create a Simple Process Flow Diagram • Determine the start and stop points to your flow of process steps . The stop point is typically near the customer. • Walk through the flow, writing down the process steps as they exist now (Rule of thumb: Pretend your are the part). Make sure you use a verb to describe the process step. • You can be very general or very specific. • General: “Machine Part” • Specific: “Turn part, grind outside diameter, and deburr part” • At a minimum, record the process steps, decision points, and transportation methods • Once you have roughly mapped out the process, make it more formal by adding symbols. • Once finished, sign and date the flow diagram with a revision level.
What Can Be Included in a Simple Process Flow Diagram • Transportation methods • Start and Stop points • Decision points • Inventory/Storage points • How many operators at each process step • Process parameters for each step: Cycle time, throughput time, scrap rate, etc. • Responsibilities for each step
Process Flow Diagram Symbols External Transportation Decision Point Inventory/Storage Activity (Process Step) Start/Stop Data Box c/t c/o u/t FTQ Push Material Data box for recording cycle time, first time quality and other process operating characteristics
Exercise for Process Map • Take a critical operation in your work place and map it with a simple process flow diagram.
A Deployment Flow Chart (Swim Lane) • Here a "department" or "agency" dimension is added horizontally along the top of the chart. You may use individuals, groups, departments, functions, etc. - whatever kinds of 'units' play major roles in the process. • Draw vertical lines to separate the functional boundaries. • When the flow moves from one function to another, a horizontal line denotes this. • Draw the sequence of activities from top to bottom. • Use the task and decision-making symbols as before and always connect symbols with arrows indicating the direction of flow.
Exercise for Deployment Chart • Convert your simple flow diagram into a deployment chart
SIPOC • Suppliers: The entities that provide whatever is worked on in the process (information, forms, material). The supplier may be an outside vendor or another division or a coworker (as an internal supplier). • Input: The information or material provided by the supplier and used by the process.. • Process: The steps used to convert inputs into outputs. (some steps are value added and some are not value added) • Output: The product, service or information being sent to the customer. This is what the customer pays for. He/she wants output: • With good quality • Delivered on time • At a competitive price • Customers: The next step in the process, or the final (external) customers.
How To Create a SIPOC Diagram • Create an area that will allow the team to post additions to the SIPOC diagram. This could be: • A transparency (shown with an overhead projector) made of the SIPOC template • Flip charts with headings (S-I-P-O-C) written on each • Headings written on post-it notes posted to a wall. • Begin with the process. Map it in four to five general steps. • Identify the outputs of this process. • Identify the customers that will receive the outputs of this process. • You can add a sixth column and list the customer’s requirements (CR) such as a blueprint number, specification number, quality goals, and delivery goals. • Identify the inputs required for the process to function properly. • Identify the suppliers of the inputs that are required by the process.
SIPOC Diagram Exercise • Take your simple process flow diagram and use it to build a SIPOC diagram.
Other Mapping Techniques • Value Stream Mapping: Every lean event or initiative should start with a value stream map (VSM). In addition to showing the sequence of process steps, the map helps identify areas of process waste.