Download
1 / 5
50 likes | 60 Views
Join us at the Nordic Forum for Geo-statistics seminar in Copenhagen on March 25-26, 2004, to learn about the latest advancements in mapping tools and their implementation. Discover the possibilities of using maps in statistical dissemination with PX-iMap, a user-friendly tool. Explore how 85,000 maps were generated in the first year, with options to view data for regions, select multiple maps in one file, and enjoy better quality maps.

E N D
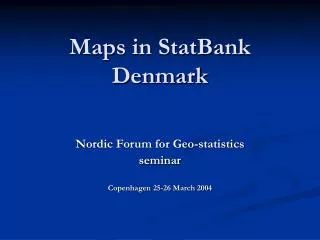
Maps in StatBank Denmark Nordic Forum for Geo-statistics seminar Copenhagen 25-26 March 2004
Introduction • One year with maps • PX-iMap is the tool • Easy to implement • Thank you SSB
Map possibilities ... • Example page • 400 cubes with regions • Use maps on ... - Municipality - County - Europe - World • 85.000 maps first year
Live Demo ... www.statbank.dk
The Future ... • See data for a region (by click or mouse over) • Select between more maps in one file • Better quality maps • More active use in statistical dissemination