Download

1 / 16
160 likes | 268 Views
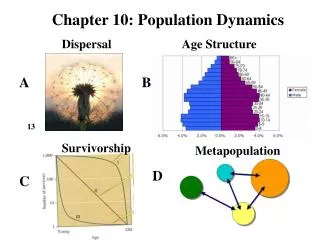
Chapter 10 Population Dynamics. Estimating Patterns of Survival. Three main ways of estimating patterns of survival within a population: Identify a large number of individuals that are born about the same time (=cohort) and keep records of them from birth to death ---> cohort life table

E N D
Estimating Patterns of Survival • Three main ways of estimating patterns of survival within a population: • Identify a large number of individuals that are born about the same time (=cohort) and keep records of them from birth to death ---> cohort life table • Record the age at death of a large number of individuals ---> static life table • Determine patterns of survival for the population from the age distribution
Static Life Tables and Survivorship Curves Example: Survival pattern of Dall sheep Plotting number of survivors against age produces a survivorship curve
Types of Survivorship Curves • Type I Survivorship Curve • A pattern in which most of the individuals of the population survive to maturity • Or, most individuals of the population do not die until they reach some genetically programmed uniform age
Types of Survivorship Curves cont. • Type II Survivorship Curve • Relatively constant death rates with age • Equal probability that an individual will die at any particular age
Types of Survivorship Curves cont. • Type III Survivorship Curve • A pattern in which their is an extremely steep juvenile mortality and a relatively high survivorship afterward • Most offspring die before they reach reproductive age
Age Distribution • Age distribution can tell you a lot about a population – periods of successful reproduction; periods of high and low survival; whether older individuals are being replaced; whether a population is growing, declining, etc.
Rates of Population Change: Combining a Cohort Life Table with a Fecundity Schedule • Fecundity schedule -the tabulation of birth rates (the number of young born per female per unit time) for females of different ages in a population • By combining the information in a fecundity schedule with data from a life table, we can estimate several important characteristics of a population
Example: A Population with Discrete Generations • nx, the number of individuals in the population surviving to each age interval • lx, survivorship, the proportion of the population surviving to each age x • mx,average number of progeny produced by each individual in each age interval • lx mx, the product of l and m • Net reproductive rate, R0 R0 = lx mx • To calculate the number of progeny produced by a population in a given time interval, multiply R0 by the initial number of individuals in the population. Example: 2.4177 x 996 plants = 2408
Geometric Rate of Increase • The ratio of population increase at two points in time: = Nt+1 n • Where, Nt+1 is the size of the population at a later time, and Nt is the size of the population at an earlier time Example: = 2408 = 2.4177 996
More on net reproductive rate: • R0 is an indication of the expected number of female offspring which a newly born female will produce during her life span • It’s an indication of whether a female replaces herself in the population • R < 1, the population will decline • R = 1, the population will remain constant • R > 1, population will increase (more offspring produced than needed to replace the female)
Mean Generation Time (T) T = [∑ (x lx mx ] / Ro where x is age Example from the common mud turtle: These turtles have an average generation time of 10.6 years: = 6.4/0.601 = 10.6
per capita rate of increase (r) r = ln Ro / T Turtle example: r = ln (0.601) / 10.6 r = -0.05