Download
1 / 1
10 likes | 124 Views
DNA Microarray Analysis of Region-Specific Gene Expression in the Mouse Epididymis Nelson Hsia and Gail A. Cornwall Department of Cell Biology and Biochemistry, Texas Tech University Health Sciences Center, Lubbock, TX. ABSTRACT

E N D
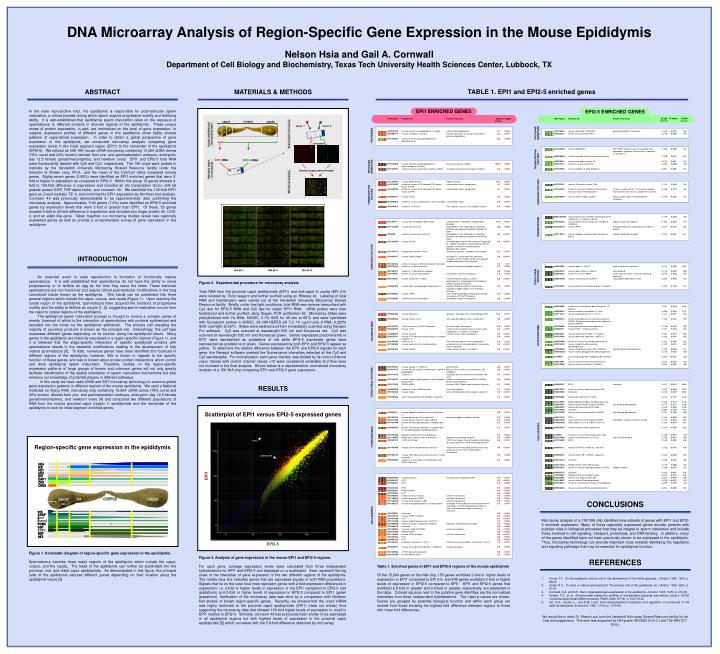
DNA Microarray Analysis of Region-Specific Gene Expression in the Mouse Epididymis Nelson Hsia and Gail A. Cornwall Department of Cell Biology and Biochemistry, Texas Tech University Health Sciences Center, Lubbock, TX ABSTRACT In the male reproductive tract, the epididymis is responsible for post-testicular sperm maturation, a critical process during which sperm acquire progressive motility and fertilizing ability. It is well-established that epididymal sperm maturation relies on the exposure of spermatozoa to different proteins in discrete regions of the epididymis. These unique zones of protein expression, in part, are maintained on the level of gene expression. In support, expression profiles of different genes in the epididymis show highly diverse patterns of regionalized expression. In order to obtain a global perspective of gene expression in the epididymis, we conducted microarray analysis comparing gene expression levels in the initial segment region (EPI1) to the remainder of the epididymis (EPI2-5). We utilized an NIA 15K mouse cDNA microarray containing 15,264 cDNA clones (78% novel and 22% known) derived from pre- and periimplantation embryos, embryonic day 12.5 female gonad/mesonephros, and newborn ovary. EPI1 and EPI2-5 total RNA were fluorescently labeled with Cy5 and Cy3, respectively. The 15K chips were probed in triplicate by the Vanderbilt University Microarray Shared Resource facility under the direction of Shawn Levy, Ph.D., and the mean of the Cy5/Cy3 ratios compared among genes. Eighty-seven genes (0.56%) were identified as EPI1-enriched genes that were 2-fold or higher in expression as compared to EPI2-5. Within this group 12 genes showed 4-fold to 130-fold difference in expression and included an ets transcription factor, milk fat globule protein-EGF, TNF-alpha factor, and connexin 43. We identified the 130-fold EPI1 gene as Cres3 (cystatin TE-1) and confirmed its EPI1 expression by Northern blot analysis. Connexin 43 was previously demonstrated to be caput-enriched, also confirming the microarray analysis. Approximately 1140 genes (7.4%) were identified as EPI2-5 enriched genes by expression levels that were 2-fold or greater than EPI1. Of these, 50 genes showed 5-fold to 20-fold difference in expression and included zinc finger protein 40, COX-2, and an elafin-like gene. Taken together, our microarray studies reveal new regionally expressed genes as well as provide a comprehensive survey of gene expression in the epididymis. MATERIALS & METHODS TABLE 1. EPI1 and EPI2-5 enriched genes EPI1 ENRICHED GENES EPI2-5 ENRICHED GENES corpus cauda caput laser 2 laser 1 4 3 5 1 PROTEASE INHIBITORS 2 Isolate total RNA and fluorescently label Scanning the microarray PROTEASES emission TRANSCRIPTION FACTORS EPI1 RNA EPI2-5 RNA PROTEASE INHIBITORS Hybridize target to microarray Overlay images and normalize Microarray Analysis SIGNALING FACTORS TRANSCRIPTION FACTORS TRANSPORTERS INTRODUCTION An essential event in male reproduction is formation of functionally mature spermatozoa. It is well established that spermatozoa do not have the ability to move progressively or to fertilize an egg by the time they leave the testis. These testicular spermatozoa are non-functional and require critical post-testicular modifications in the long convoluted tubule known as the epididymis. This tubule can be subdivided into three general regions which include the caput, corpus, and cauda (Figure 1). Upon reaching the cauda region of the epididymis, spermatozoa have acquired the functions of progressive motility and the ability to fertilize an oocyte [1, 2], suggesting sperm maturation occurs from the caput to corpus regions of the epididymis. The epididymal sperm maturation process is thought to involve a complex series of events, foremost of which is the interaction of spermatozoa with proteins synthesized and secreted into the lumen by the epididymal epithelium. The primary cell releasing the majority of secretory products is known as the principal cell. Interestingly, this cell type expresses different genes depending on its location along the epididymal tubule. Many genes in the epididymis are distinctly expressed in a region-specific manner (Figure 1), and it is believed that the stage-specific interaction of specific epididymal proteins with spermatozoa results in the essential modifications leading to the development of fully mature spermatozoa [3]. To date, numerous genes have been identified and localized in different regions of the epididymis; however, little is known in regards to the specific function of these genes, and less is known about protein-protein interactions which control and drive epididymal sperm maturation. Therefore, studies on the region-specific expression patterns of large groups of known and unknown genes will not only greatly facilitate identification of the spatial orientation of sperm maturation mechanisms but also enhance our knowledge of potential players in different pathways. In this study we have used cDNA and EST microarray technology to examine global gene expression patterns in different regions of the mouse epididymis. We used a National Institutes on Aging (NIA) microarray chip containing 15,264 cDNA clones (78% novel and 22% known) derived from pre- and periimplantation embryos, embryonic day 12.5 female gonad/mesonephros, and newborn ovary [4] and compared two different populations of RNA from the mouse proximal caput (region 1) epididymidis and the remainder of the epididymis to look for initial segment enriched genes. SIGNALING FACTORS NIA 5K II NIA 5K III NIA 5K I STRUCTURAL PROTEINS Figure 2. Experimental procedure for microarray analysis Total RNA from the proximal caput epididymidis (EPI1) and mid-caput to cauda (EPI 2-5) were isolated by Trizol reagent and further purified using an RNeasy kit. Labeling of total RNA and hybridization were carried out at the Vanderbilt University Microarray Shared Resource facility. Briefly, under low-light conditions, total RNA was reverse transcribed with Cy3 dye for EPI2-5 RNA and Cy5 dye for region EPI1 RNA. cDNA probes were then hydrolyzed and further purified using Qiagen PCR purification kit. Microarray slides were prehybridized with 1% BSA, 5XSSC, 0.1% SDS for 45 min at 65°C and were hybridized with fluorescent probes in 3XSSC, 24 mM HEPES pH 7.0, 10 g/ml poly A RNA, 0.225% SDS overnight at 65°C. Slides were washed and then immediately scanned using Genepix Pro software. Cy5 was scanned at wavelength 635 nm and fluoresces red. Cy3 was scanned at wavelength 532 nm and fluoresces green. Genes expressed predominantly in EPI1 were represented as gradations of red while EPI2-5 expressed genes were represented as gradations of green. Genes expressed by both EPI1 and EPI2-5 appear as yellow. To determine the relative difference between the EPI1 and EPI2-5 signals for each gene, the Genepix software overlaid the fluorescence intensities detected at the Cy5 and Cy3 wavelengths. For normalization, each gene intensity was divided by its control channel value. Genes with control channel values <10 were considered unreliable and thus were not included in the final analysis. Shown below is a representative, normalized microarray analysis of a 15K NIA chip comparing EPI1 and EPI2-5 gene expression. TRANSPORTERS OTHER ENZYMES STRUCTURAL PROTEINS RESULTS Scatterplot of EPI1 versus EPI2-5 expressed genes UNCLASSIFIED OTHER ENZYMES cres3 Region-specific gene expression in the epididymis connexin 43 HE4 HE4 D/E D/E HE1 HE1 HE2 HE2 EPI1 B/C B/C EAP1 EAP1 GPX GPX CRES CRES CONCLUSIONS Microarray analysis of a 15K NIA chip identified new subsets of genes with EPI1 and EPI2-5 enriched expression. Many of these regionally expressed genes encode proteins with putative roles in biological processes that may be integral to sperm maturation and include those involved in cell signaling, transport, proteolysis, and DNA binding. In addition, many of the genes identified have not been previously shown to be expressed in the epididymis. Thus, microarray technology can provide important clues towards identifying the regulatory and signaling pathways that may be essential for epididymal function. enk enk CRBP CRBP UNCLASSIFIED A - A - raf a red 5 5 - - POMC POMC ? ? GGT GGT SGP 2 NGF NGF HE5 HE5 EPI2-5 Figure 1. Schematic diagram of region-specific gene expression in the epididymis. Spermatozoa traverse three major regions of the epididymis which include the caput, corpus, and the cauda. The head of the epididymis can further be subdivided into the proximal, mid, and distal caput epididymidis. As demonstrated in this figure, the principal cells of the epididymis express different genes depending on their location along the epididymal tubule [3]. Figure 3. Analysis of gene expression in the mouse EPI1 and EPI2-5 regions. For each gene, average expression levels were calculated from three independent hybridizations for EPI1 and EPI2-5 and displayed on a scatterplot. Axes represent the log scale of the intensities of gene expression in the two different regions of the epididymis. The middle blue line indicates genes that are expressed equally in both RNA populations. Signals that lie on the outer blue lines represent genes with 2-fold expression differences in expression; i.e. 2-fold or higher levels in expression in the EPI1 compared to EPI2-5 (red gradations) and 2-fold or higher levels of expression in EPI2-5 compared to EPI1 (green gradations). Verification of the microarray data was done by a comparison with Northern blot studies of known region-specific genes. Recently, we showed that the cres3 mRNA was highly restricted to the proximal caput epididymidis (EPI1) (data not shown) thus supporting the microarray data that showed 130-fold higher levels of expression in cres3 in EPI1 relative to EPI2-5. Similarly, connexin 43 has previously been shown to be expressed in all epididymal regions but with highest levels of expression in the proximal caput epididymidis [5] which correlates with the 5.8-fold difference observed by microarray. • REFERENCES • 1. Turner, T.T., On the epididymis and its role in the development of the fertile ejaculate. J Androl, 1995. 16(4): p. 292-8. • Jones, R.C., To store or mature spermatozoa? The primary role of the epididymis. Int J Androl, 1999. 22(2): p. 57-67. • Cornwall, G.A. and S.R. Hann, Specialized gene expression in the epididymis. J Androl, 1995. 16(5): p. 379-83. • Tanaka, T.S., et al., Genome-wide expression profiling of mid-gestation placenta and embryo using a 15,000 mouse developmental cDNA microarray. PNAS, 2000. 97(16): p. 9127-9132. • Cyr, D.G., Hermo, L., and D.W. Laird, Immunocytochemical localization and regulation of connexin43 in the adult rat epididymis. Endocrinol, 1996. 137(4): p. 1474-84. Table 1. Enriched genes in EPI1 and EPI2-5 regions of the mouse epididymis Of the 15,264 genes on the NIA chip, 156 genes exhibited 2-fold or higher levels of expression in EPI1 compared to EPI 2-5, and 449 genes exhibited 2-fold or higher levels of expression in EPI2-5 compared to EPI1. EPI1 and EPI2-5 genes that exhibited 2.5-fold or greater and 3.8-fold or greater, respectively, are presented in the table. Colored squares next to the putative gene identities are the normalized intensities from three independent hybridizations. The t-test p-values are shown. Genes are grouped by potential biological function and within each group are ranked from those showing the highest fold difference between regions to those with lower fold differences. We would like to thank Dr. Shawn Levy from the Vanderbilt Microarray Shared Resource facility for his help and suggestions. This work was supported by NIH grants HD33903 (G.A.C.) and T32-HD07271 (N.H.).