Download
1 / 5
50 likes | 84 Views
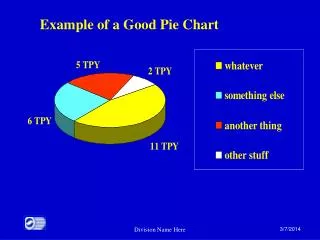
This tool allows you to launch Gtplot from GSS for creating Pie Charts and specialty plots to graphically display fluid cation-anion balance. The radial direction represents the total electrical equivalent content. Customize colors, fonts, and sizes by right-clicking on labels or axes. Access configuration and view dialogs by double-clicking on the plot. Toggle sample labels, legend, and more. Control Pie Chart details from the Plot pane, including showing all labels and minor ions. Cycle through samples and groups using the Samples pane. Enhance your analysis with this interactive visualization tool.

E N D
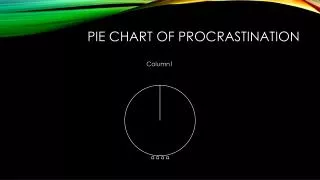
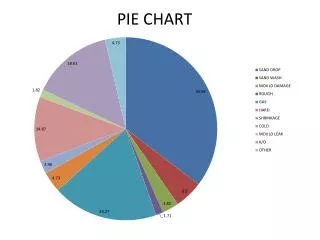
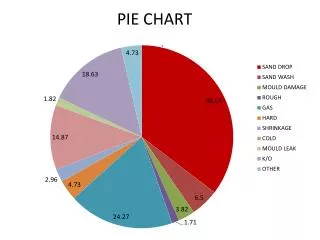
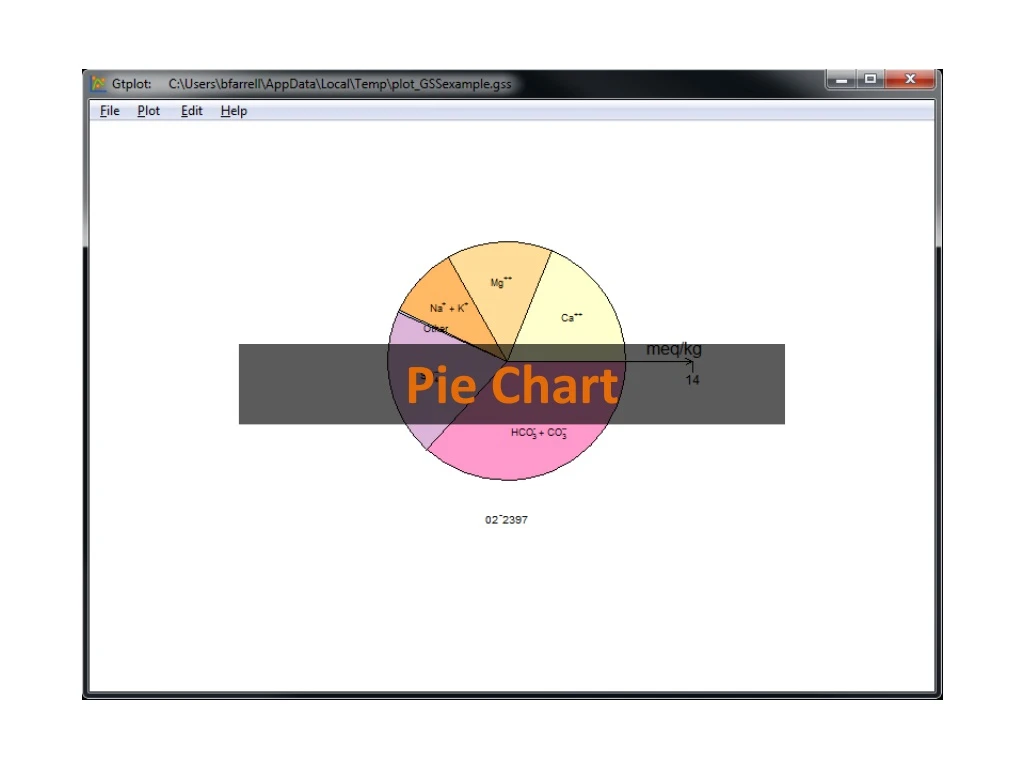
You can launch Gtplot from GSS to create Pie Charts and other specialty plots. Graphs → Pie Chart…
The Pie chart shows the fluid’s cation-anion balance graphically, with the radial direction representing the fluid’s total electrical equivalent content. Right-click on labels or axes to change color, font, size, etc. Double-click on plot to bring up the Pie Chart configuration dialog. Double-click outside the plot to open the View dialog. Toggle sample labels, legend, and more.
Radial direction shows total electrical equivalent content. • You control details of the Pie Chart from the Plot pane. Uncheck “Common ions” and check “Show all labels” to include minor ions.
You can cycle through samples one at a time… • You control which samples are displayed from the Samples pane. Use Block, Next block to cycle through groups of samples. Select the samples to plot.