Download
1 / 90
940 likes | 982 Views
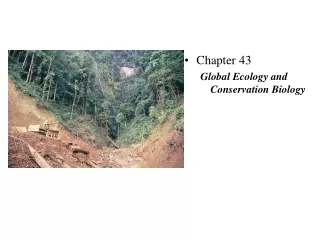
Global Ecology. Chapter 25 Global Ecology. CONCEPT 25.1 Elements move among geologic, atmospheric, oceanic, and biological pools at a global scale. CONCEPT 25.2 Earth is warming due to anthropogenic emissions of greenhouse gases. Chapter 25 Global Ecology.

E N D
Chapter 25 Global Ecology • CONCEPT 25.1 Elements move among geologic, atmospheric, oceanic, and biological pools at a global scale. • CONCEPT 25.2 Earth is warming due to anthropogenic emissions of greenhouse gases.
Chapter 25 Global Ecology • CONCEPT 25.3 Anthropogenic emissions of sulfur and nitrogen cause acid deposition, alter soil chemistry, and affect the health of ecosystems. • CONCEPT 25.4 Losses of ozone in the stratosphere and increases in ozone in the troposphere each pose risks to organisms.
Introduction Movements of biologically important elements are linked at a global scale that transcends ecological boundaries. Humans are increasingly changing the physical and chemical environment on a global scale.
Introduction Atmospheric emissions of pollutants, dust, and greenhouse gases have caused widespread environmental problems. A major focus of global ecology is the study of the environmental effects of human activities.
CONCEPT 25.1 Elements move among geologic, atmospheric, oceanic, and biological pools at a global scale.
Concept 25.1 Global Biogeochemical Cycles Global cycling of carbon (C), nitrogen (N), phosphorus (P), and sulfur (S) are emphasized because of their biological importance and their roles in human alteration of the global environment.
Concept 25.1 Global Biogeochemical Cycles Pool, or reservoir: Amount of an element in a component of the biosphere. Flux: Rate of movement of an element between pools. Examples: Terrestrial plants are a pool of carbon; photosynthesis represents a flux.
Concept 25.1 Global Biogeochemical Cycles The Carbon Cycle: C is critical for energy transfer and the construction of biomass. C is dynamic, moving between different pools over time scales of weeks to decades.
Concept 25.1 Global Biogeochemical Cycles Changes in the global C cycle are influencing Earth’s climate. C in the atmosphere occurs primarily as carbon dioxide (CO2) and methane (CH4). Both are greenhouse gases that affect the global climate.
Concept 25.1 Global Biogeochemical Cycles Anthropogenic release of C to the atmosphere from the terrestrial pool results from land use change, mostly deforestation (20%); and from burning fossil fuels (80%). Before the mid-nineteenth century, deforestation was the main anthropogenic flux.
Concept 25.1 Global Biogeochemical Cycles Removing the forest canopy warms the soil, increasing rates of decomposition and respiration. Burning trees releases CO2, and small amounts of CO and CH4. In the 20th century, major deforestation shifted from the mid-latitudes to the tropics.
Concept 25.1 Global Biogeochemical Cycles Anthropogenic emissions of CO2 more than doubled from 1970 to 2011. About half is taken up by the oceans and terrestrial biota. But this proportion will decrease because terrestrial and ocean uptake will not keep pace with the rate of atmospheric increase.
Concept 25.1 Global Biogeochemical Cycles Anthropogenic emissions of CH4 have also increased. Atmospheric CH4 levels are much lower than CO2, but CH4 is a more effective greenhouse gas.
Concept 25.1 Global Biogeochemical Cycles Anthropogenic sources of CH4 include: Burning fossil fuels Agricultural development (primarily rice grown in flooded fields) Burning of forests and crops Livestock production
Concept 25.1 Global Biogeochemical Cycles Higher concentrations of CO2 may stimulate photosynthesis. But experiments have shown that increased photosynthetic rates may be short lived, and plants will acclimate to higher concentrations. For forest trees, increased CO2 uptake may be sustained longer.
Concept 25.1 Global Biogeochemical Cycles Ocean acidity has increased 30% over the last century. Further increase is predicted by models. Many marine organisms form shells of carbonate. Increasing acidity will dissolve existing shells and lower carbonate concentrations will decrease the ability to synthesize new shells.
Concept 25.1 Global Biogeochemical Cycles On Australia’s Great Barrier Reef, calcium carbonate formation declined by 14% from 1990 to 2009. Anthropogenic CO2 emissions therefore have potential to tremendously alter the diversity and function of marine ecosystems.
Figure 25.5 Rates of Calcification of Corals on Australia’s Great Barrier Reef, 1900–2005
Concept 25.1 Global Biogeochemical Cycles Since the mid-19th century, CO2 concentrations have increased at a rate faster than at any other time in the past 400,000 years. Even if CO2 emissions are reduced dramatically, CO2 levels will remain high due to a time lag in ocean uptake (decades to centuries).
Concept 25.1 Global Biogeochemical Cycles The Nitrogen Cycle: N is a constituent of enzymes and proteins and often limits primary productivity. N and C cycles are tightly coupled through the processes of photosynthesis and decomposition.
Concept 25.1 Global Biogeochemical Cycles The largest N pool is atmospheric N2, which is not available to most organisms. N-fixing bacteria are able to convert it to a useable form. Fixed N compounds are called reactive—they can participate in chemical reactions.
Concept 25.1 Global Biogeochemical Cycles Humans have altered the N cycle even more than the C cycle. Rate of N2 fixation by humans now exceeds natural biological rates. Emissions of N from industrial and agricultural activities cause widespread environmental changes, including acid precipitation.
Figure 25.8 Changes in Anthropogenic Fluxes in the Global Nitrogen Cycle
Concept 25.1 Global Biogeochemical Cycles Fertilizers are made using the Haber–Bosch process. Growing N-fixing crops such as alfalfa, soybeans, and peas has increased biological N2 fixation. Flooding of agricultural fields for rice has increased N2 fixation by cyanobacteria.
Concept 25.1 Global Biogeochemical Cycles Many other forms of reactive N are emitted to the atmosphere, mostly from fossil fuel combustion. These compounds can undergo chemical reactions in the atmosphere and are potentially available for biological uptake. They are returned to ecosystems by atmospheric deposition.
Concept 25.1 Global Biogeochemical Cycles The Phosphorus Cycle: P can limit primary productivity in aquatic ecosystems and some terrestrial ecosystems. P availability can control the rate of N-fixation, which has a high metabolic demand for P.
Concept 25.1 Global Biogeochemical Cycles The C, N, and P cycles are linked through photosynthesis and NPP, decomposition, and N2 fixation. P has no atmospheric pool, except as dust. The largest pools are in soils and marine sediments.
Concept 25.1 Global Biogeochemical Cycles P in aquatic systems is lost to the sediments. This is cycled again with tectonic uplift and weathering of rocks. Human influences on the P cycle include agricultural fertilizers, sewage and industrial wastes, and increased terrestrial erosion.
Concept 25.1 Global Biogeochemical Cycles P fertilizers are made from marine sedimentary rock. Mining releases four times more P than natural rock weathering. Flux of anthropogenic P from terrestrial to aquatic ecosystems can have negative impacts such as eutrophication.
Concept 25.1 Global Biogeochemical Cycles The Sulfur Cycle: S is a constituent of some amino acids, DNA, and RNA, but is probably never limiting to growth. Major pools of S are in rocks, sediments, and oceans as dissolved sulfate (SO42–).
Concept 25.1 Global Biogeochemical Cycles In the atmosphere, S compounds are transformed to SO42– and H2SO4 (sulfuric acid), which are removed quickly by precipitation. Anthropogenic emissions have quadrupled since the Industrial Revolution. Most comes from burning sulfur-containing coal and oil and from smelting.
CONCEPT 25.2 Earth is warming due to anthropogenic emissions of greenhouse gases.
Concept 25.2Global Climate Change Climate change, especially change in frequency of extreme events (droughts, storms, etc.) will have profound effects on ecosystems. Extreme events are often critical in determining species’ geographic ranges.
Concept 25.2Global Climate Change Weather: Current state of the atmosphere at any given time. Climate: Long term description of weather, including average conditions and the full range of variation. Climate variation occurs at multiple time scales—from daily and seasonal to decadal.
Concept 25.2Global Climate Change Climate change refers to directional change in climate over a period of at least three decades. Earth is currently experiencing significant climate change (IPCC 2013). Average global surface temperature increased 0.8°C between 1880 and 2012.
Figure 25.11 Changes in Global Temperature and Precipitation (Part 1)
Concept 25.2Global Climate Change Associated with this warming, there has been: Widespread retreat of mountain glaciers Thinning of the polar ice caps Melting permafrost A 19-cm rise in sea level since 1900
Concept 25.2Global Climate Change The warming trend has not been consistent around the globe. Some regions have seen greater warming, especially mid- to high latitudes in the Northern Hemisphere.
Figure 25.11 Changes in Global Temperature and Precipitation (Part 2)
Concept 25.2Global Climate Change Precipitation in the high latitudes of the Northern Hemisphere has increased, but weather has been drier in the subtropics and tropics. There is also a trend of increasing frequency of extreme weather events such as hurricanes and heat waves.
Concept 25.2Global Climate Change Greenhouse effect: Warming of Earth by atmospheric absorption and reradiation of infrared radiation emitted by Earth’s surface. It is due to greenhouse gases in the atmosphere, primarily water vapor, CO2, CH4, and N2O.
Concept 25.2Global Climate Change The Intergovernmental Panel on Climate Change (IPCC) was established in 1988. It includes experts in atmospheric and climate science from around the world. They use modeling and analysis of data from the scientific literature to evaluate underlying causes of observed climate change and scenarios for the future.
Concept 25.2Global Climate Change The IPCC releases assessment reports to promote understanding of climate change among scientists, policymakers, and the general public. In recognition of their efforts to spread “knowledge about man-made climate change,” the IPCC was awarded the Nobel Peace Prize in 2007.
Concept 25.2Global Climate Change In the third report (2001), the IPCC concluded that the majority of the observed global warming is attributable to human activities. While this conclusion is debated in the political arena, it is backed by the majority of the world’s leading atmospheric scientists.