Download
1 / 21
210 likes | 468 Views
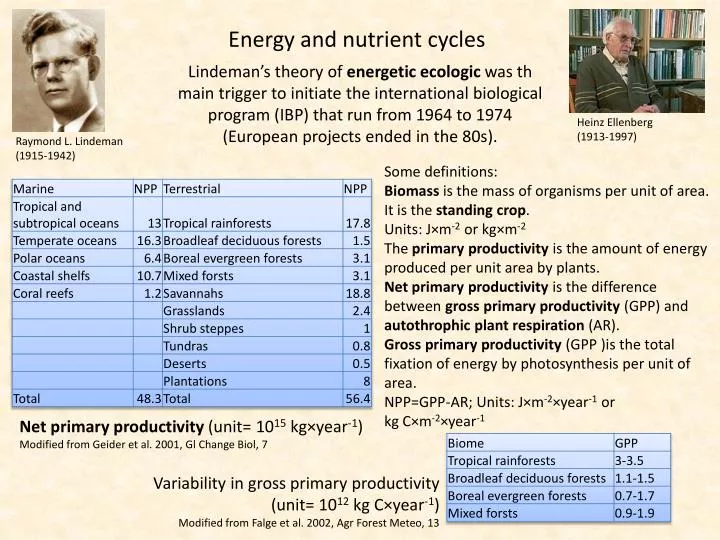
Energy and nutrient cycles. Lindeman’s theory of energetic ecologic was th main trigger to initiate the international biological program (IBP) that run from 1964 to 1974 (European projects ended in the 80s). . Heinz Ellenberg (1913-1997). Raymond L. Lindeman (1915-1942). Some definitions:

E N D
Energy and nutrient cycles Lindeman’s theory of energetic ecologic was th main trigger to initiate the international biological program (IBP) that run from 1964 to 1974 (European projects ended in the 80s). Heinz Ellenberg (1913-1997) Raymond L. Lindeman (1915-1942) Some definitions: Biomass is the mass of organisms per unit of area. It is the standing crop. Units: J×m-2 or kg×m-2 The primary productivity is the amount of energy produced per unit area by plants. Net primary productivity is the difference between gross primary productivity (GPP) and autothrophic plant respiration (AR). Gross primaryproductivity(GPP )is the total fixation of energy by photosynthesis per unit of area. NPP=GPP-AR; Units: J×m-2×year-1 or kg C×m-2×year-1 Net primary productivity (unit= 1015 kg×year-1)Modified from Geider et al. 2001, Gl Change Biol, 7 Variability in gross primary productivity (unit= 1012 kg C×year-1)Modified from Falge et al. 2002, Agr Forest Meteo, 13
The earth energy budget Sun radiation 100% = 1.7 1017 Watt 42 100 0.002 reflected radiation Tidal energy Heat energy 23 0.018 23 34 Atmosperic water Only 0.023% (4 1013 Watt) of the incoming radiation of the sun is converted in organic matter 1 Wind 0.023 0.006 Fungi Plants Bacteria Animals Humans 0.006 Fossilized energy Geothermal energy
The global oxygen cycles UV OH O O H2O H2O O2 O2 O2 H O3 Atmosphere O2+2CO→2CO2 O2 Oxydation Vulcanism Photo-synthesis Respiration CO Water cycle O2+4FeO→2Fe2O3 Biosphere Pedosphere Bleaching O2 Ground water Hydrosphere Litosphere The major oxygen producers are marine algae and terrestrial green plants. The major processes that reduce atmospheric oxygen are CO and iron oxidation.
Local and global flux of matter in the biosphere Global cycles of main elements: C, N, O, H Local cycles of P and of trace elements: K, Ca, Mg, Cu, Zn, B, Cl, Mo, Mn, Fe Atmos-phere Bacteria Plants Plants Soil Consumers Soil Consumers Decom-posers Litter Decom-posers Litter
The energy budget of the biosphere Amount of radiation that reaches the biosphere 100% Net production P is calculated from 3.7: average carbon fixation rate of chlorophyll R: relative photosynthesis rate, k: extinction coefficient × m-1 (1 in terrestrial systems) C: amount of chlorophyll × m-3 83% 57% 40% 3% 17% 1-3% 57% Global average energy budget On average about 10% of energy is transmitted from one trophic levels to the next. The marine potential productivity depends on latitude and season.
NPP increases with standing crop Modified from Whittaker, 1975, Ecol. Monogr, 23. Photosynthetic effeciencydiffers betwen habitat types Modified from Webb et al., 1983, Ecology, 64. Photosynthetic effciciency in the Argentine pampas is limited by water and temperature. Modified from Jobbagy et al. 2002, Ecology, 83
The rate of energy transferred to the next trophic level depends on habitat type and NPP. Modified from Cebrian 1999, Am Nat, 154. P: Assimilation at trophic level n P: Production at trophic level n I: Consumption at trophic level n Consumption efficiency Transfer efficiency Assimilation efficiency Production efficiency
The global cycle of potentially biologically active carbon Microbial respiration 60 Atmosphere 720 × 1012 kg Plant respiration 50 Human emissions 7.7Land use 1.5 Photosynthesis123 90.2 93 Plant and fungalbiomass 600 Ocean surface 700 Deposition 13 Soil carbon 2,300 Deep ocean 1,000 Fossil carbon >5,000 2.8 Reactive sediments >6,000 Th annual increase of athmospheric carbon from fossil fuel burning Average Annual Carbon Fluxes for the period 2000-2008 (Modified from LeQuéré et al., 2009)
The Nitrogen cycles The marine nitrogen cycle The soil nitrogen cycle Atmosphere Atmosphere Rain Rain N2 N2 N2 Euphotic zone Phytoplankton Denitri-fication Clostri-dium; Pseudo-monas Nitrogen fixation Marine food web Decomposeranerobic Bacteria, Fungi N recycling NO3- NH4OH NH4OH NO3- symbiontic Rhizobium Ammoni-fication Dark zone N recycling Nitro-bacter N2 NH4OH NO2- NH4OH Denitrification Nitrification Nitrification Nitrosomonas NO3- free living Azotobacter Soil Leaching into ocean water
The succession of nutrient uptake can be traced by radioactive markers 32P uptake in freshwater systems Nutrient uptake by microorganisms takes a few hours. Plants and algae need up to a day and animals a few days for maximum uptake.
The localflux of energy and matter An ecosystem is aspatiallyrestrictedcommunity of living and organisms (plants, animals,and microbes) thatinteractwith the abioticcomponents of their environment Arthur George Tansley (1871-1955) ecosystem = biocoenosis + habitat A communityis a group of speciesthatpotentiallyinteract Anassemblyisanyassociation of specieswithin a givenarea Examples of ecosystems: LakesForestsGrasslands MangrovesTundrasShrublands CoralreefGeothermalventsDeserts Ecosystemsarecharacterized by a flux of energyand a circulation of inorganicmatter. Thereisstill a disputewhether ‚ecosystems’ are ‚systems’ in a strictsense. Habitatsthatare not ecosystems in a strict sens: Rivers Oceans Agricultures
O2, CO2, H20 Light A simple scheme of an ecosystem O2, CO2, H20 Consumers Producers Herbivores Plants Carnivores Algae Parasites Herbivores Dead organic matter Microvores Reducers Saprovores Consumers Mineralisers Minerals Mineral sink
Regulated or not regulated? Modelling ecosystem processes D, P, and K are the amounts of a resource at the levels of reducers (D), producers (P) and consumers (K), respectively. Then it holds The flux of matter through the ecosystem is predicted to be a steady state process Simple ecological models predict ecosystems to be self-regulated entities. Two types of regulation Self controlled system Statistical averaging
Control loop Early ecological theory saw ecosystems as self regulated entities. Examples: Predator – prey relationships Degree of herbivory Energy flux Population densities Productivity Biodiversity The variance – mean relationship of most populations follows Taylors power law The majority of species has 1.5 < z < 2.5 Z = <<2 is required for population regulation Most populations, in particular invertebrate populations are not regulated! They are not in equilibrium
Statistical averaging as a stabilizing force The Portfolio effect The average of many random variables has a lower variance than each single variable: statistical averaging Aggregate ecological variables (biomass, species richness, productivity, populations) become more stable with increasing number of independent variables. For instance, total biomass and ecosystem productivity are more stable in species rich communities. Variance Stability Number of variables
The soil system Microfauna Earthworms Darwin on earthworms From Begon, Townsend, Harper, 006. Ecology, Blackwell
The function of the edaphon Macrofauna Biomass Mesofauna Microfauna Polar desert Tundra Tropical desert Tropical forest Boreal forest Temperate forest Grassland Litter breakdown Soil organic matter accumulation Decomposers are bacteria and fungi that reduce organic material Detritivores are animal or protist consumers of dead organic matter Predators feed on soil animals or protists Microvores are animal or protist consumers of bacteria and fungi
Decomposers and detritivores Decomposition of organicmatter W is an exponential process in time t with decomposition constant k Decomposition rate increases nearly linearly with nitrogen and phosphorus content of dead plant material