Download
1 / 11
110 likes | 133 Views
Explore the fecal coliform data variations over 2003-2021 along the Lower Colorado River, noting seasonal peaks and spatial concentration changes. Discover key observations from 17 monitoring points, influencing implications for pollution mitigation strategies and ongoing water quality monitoring. Future collaboration plans and data sources are also discussed.

E N D
Water Quality Analysis of The Lower Colorado River Paula Kulis CE 394K.1
Water Quality Monitoring Points: 17 Data Points on Main River Fecal Coliform Data1982-2003
Temporal Variations: Seasonal Annual Average FC Data: Site 12475
Movie Time! • Average Monthly Variation Along River • Major Observation to make while watching: • More peaks in the Spring and Fall Z:\GISWR\GISproj\fcmonthly.avi
Temporal Variations: Annual fcreg.avi
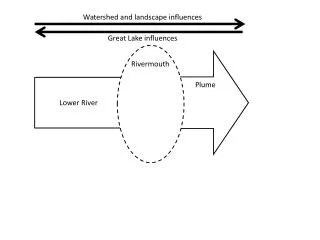
Spatial Variations • Hypothesis: FC Concentration Decreases with Distance from Austin
Conclusions • Seasons affect FC counts • Certain Years are worse than others • Pollution doesn’t “travel” down the river, but river is polluted collectively • FC Counts decrease with distance from Austin • May be other sources further down the river
Future Work: Austin • Collaboration with Shipeng Fu to compare river water quality data with groundwater data • Interpolate values • Compare Flow Data with Fecal Coliform
Data Sources: Lower Colorado River Authority Water Quality Data Discharge Data Texas Water Development Board Municipal Boundaries and Jurisdictions USGS River Reach Watershed Thank You: Dr. Maidment Richard Winkelbauer, LCRA Thank You!