Download
1 / 77
800 likes | 850 Views
Addressing challenges in quantitating mRNA expression with small tissue samples using a sensitive kinetic PCR approach. Learn about standards, dilution curves, quality control methods, and the Pfaffl method for accurate results.

E N D
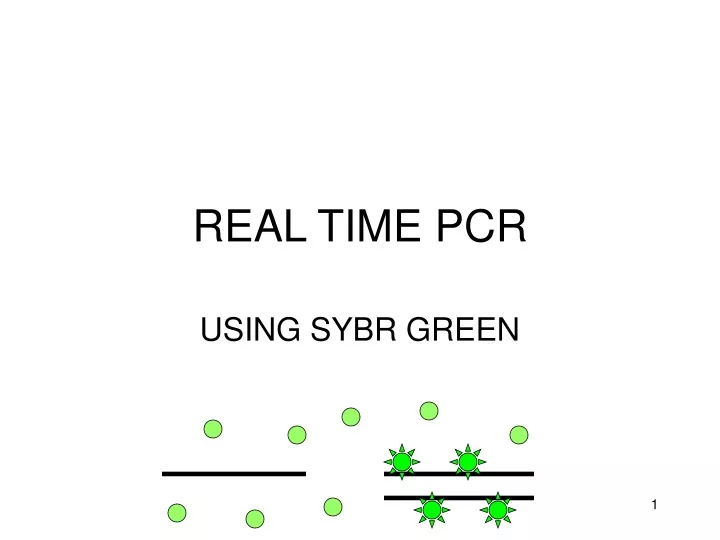
REAL TIME PCR USING SYBR GREEN
THE PROBLEM • NEED TO QUANTITATE DIFFERENCES IN mRNA EXPRESSION • SMALL AMOUNTS OF mRNA • LASER CAPTURE • SMALL AMOUNTS OF TISSUE • PRIMARY CELLS • PRECIOUS REAGENTS
THE PROBLEM • QUANTITATION OF mRNA • northern blotting • ribonuclease protection assay • in situ hybridization • PCR • most sensitive • can discriminate closely related mRNAs • technically simple • but difficult to get truly quantitative results using conventional PCR
Ratio target gene in experimental/control = fold change in target gene fold change in reference gene NORTHERN control expt 10X target gene internal control gene actin, GAPDH, RPLP0 etc 2X Corrected fold increase = 10/2 = 5
Standards • same copy number in all cells • expressed in all cells • medium copy number advantageous • correction more accurate
Standards • The perfect standard does not exist
Standards • Commonly used standards • Glyceraldehyde-3-phosphate dehydrogenase mRNA • Beta-actin mRNA • MHC I (major histocompatability complex I) mRNA • Cyclophilin mRNA • mRNAs for certain ribosomal proteins • E.g. RPLP0(ribosomal protein, large, P0; also known as 36B4, P0, L10E, RPPO, PRLP0, 60S acidic ribosomal protein P0, ribosomal protein L10, Arbp or acidic ribosomal phosphoprotein P0) • 28S or 18S rRNA
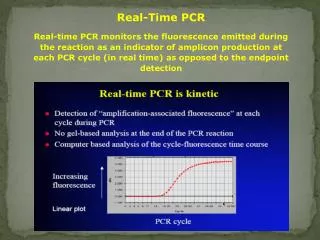
REAL TIME PCR • kinetic approach • early stages • while still linear www.biorad.com
3. intensifier 5. ccd detector 350,000 pixels 1. halogen tungsten lamp 2b. emission filters 2a. excitation filters 4. sample plate www.biorad.com
threshold Ct SERIES OF 10-FOLD DILUTIONS
dilutions target DNA target primers triplicates cDNA C C C E E E dilutions reference DNA reference primers triplicates cDNA C C C E E E Standard curve method
‘copy number’ target gene control Dilution curve target gene ‘copy number’ target gene experimental fold change in target gene= copy number experimental copy number control
C C C E E E C C C E E E ‘copy number’ reference gene experimental Dilution curve reference gene ‘copy number’ reference gene control
Real time pcr - week 1 • Two different series of diluted DNAs to do standard curve plus two unknowns • RPLPO (ribosomal protein, reference gene) • alpha-5 integrin • Get standard curve and efficiency RPLP0 and alpha-5 integrin • Determine ratio of RPLP0 and alpha-5 integrin in two unknowns (cDNA 1 and cDNA 2) • Determine melting temperature RPLP0 and alpha-5 integrin • Each person will do either RPLP0 or alpha-5 integrin
1 2 3 4 5 6 7 8 9 10 11 12 A B C D E F G H Date: protocol: 5uL H2O cDNA 1 cDNA 2 RPLP0 -4 RPLP0 -5 RPLP0 -6 RPLP0 -7 RPLP0 -8 RPLP0 -9 RPLP0 -10 add RPLP0 master mix to this row 5uL H2O cDNA 1 cDNA 2 a5-int -4 a5-int -5 a5-int -6 a5-int -7 a5-int -8 a5-int -9 a5-int -10 add a5-integrin master mix to this row
NORTHERN cDNA1 cDNA2 (target gene) alpha - 5 integrin RPLP0 (reference) Ratio alpha-5 integrin cDNA2 to cDNA1 = fold change in alpha-5 integrin fold change in RPLP0 4
Importance of controls • negative control • checks reagents for contamination
Importance of cleanliness in PCR • Contamination is major problem • Huge amplification contributes to this • Bacterial vectors contribute to this • Amplification of ds DNA is more sensitive than that of cDNA
PFAFFL METHOD • M.W. Pfaffl, Nucleic Acids Research 2001 29:2002-2007
AFTER 1 CYCLE 100% = 2.00x 90% = 1.90x 80% = 1.80x 70% = 1.70x
AFTER 1 CYCLE 100% = 2.00x 90% = 1.90x 80% = 1.80x 70% = 1.70x AFTER N CYCLES: fold increase = (efficiency)n
QUALITY CONTROL -EFFICIENCY CURVES • use pcr baseline subtraction (not curve fitting default option) - see next slide • set the threshold manually to lab standard • check all melting curves are OK • check slopes are parallel in log view • delete samples if multiple dilutions cross line together (usually at dilute end of curve) • delete samples if can detect amplification at cycle 10 or earlier • make sure there are 5 or more points • check correlation coefficient is more than 1.990
QUALITY CONTROL -EFFICIENCY CURVES • use pcr baseline subtraction (not curve fitting default option) • set the threshold manually to lab standard • check all melting curves are OK • check slopes are parallel in log view • delete samples if multiple dilutions cross line together (usually at dilute end of curve) • delete samples if can detect amplification at cycle 10 or earlier • make sure there are 5 or more points • check correlation coefficient is more than 1.990
PFAFFL METHOD M.W. Pfaffl, Nucleic Acids Research 2001 29:2002-2007
target primers triplicates cDNA C C C E E E reference primers triplicates cDNA C C C E E E
IL1-b vit RPLP0 con RPLP0 vit IL1-b con
IL1-beta IL1-b vit IL1-b con av =18.03 av =29.63 AFTER N CYCLES: change = (efficiency)n AFTER N CYCLES: ratio vit/con = (1.93)29.63-18.03 =1.9311.60 = 2053
RPLP0 RPLP0 con RPLP0 vit av =19.80 av =19.93 AFTER N CYCLES: change = (efficiency)n AFTER N CYCLES: ratio vit/con = (1.87)19.93-19.80 =1.870.13 = 1.08
ratio = (Etarget )DCt target (control-treated) (Eref )DCt ref (control-treated) ratio = change in IL1-B = 2053/1.08 = 1901 change in RPLP0