Download
1 / 63
630 likes | 642 Views
This report provides comprehensive data on pediatric incident rates, prevalence rates, and counts by race, gender, age group, diagnosis, and treatment modality. It also includes information on pediatric transplant and hospital admission rates.

E N D
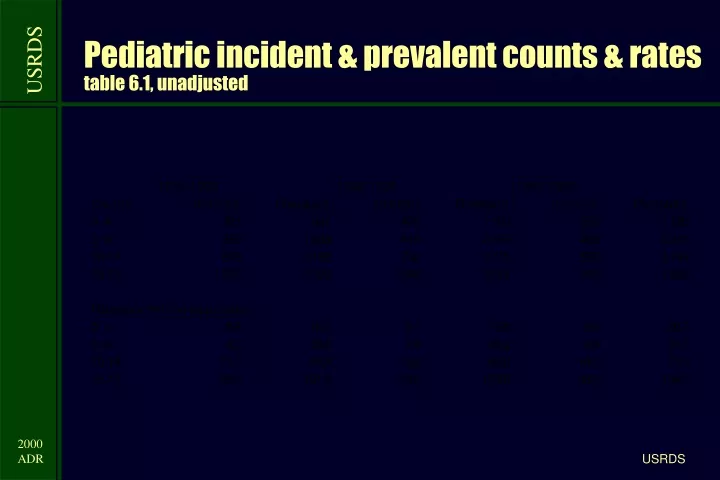
Pediatric incident & prevalent counts & ratestable 6.1, unadjusted USRDS
Pediatric incident ratesfigure 6.1, per million population, unadjusted USRDS
Pediatric incident rates by race, gender, & age groupfigure 6.2, per million population, 1996-1998, unadjusted USRDS
Incident rates: Ages 0-4figure 6.3, per million population, 1994-1998, unadjusted, by state Rate per million population USRDS
Incident rates: Ages 5-9figure 6.3, per million population, 1994-1998, unadjusted, by state Rate per million population USRDS
Incident rates: Ages 10-14figure 6.3, per million population, 1994-1998, unadjusted, by state Rate per million population USRDS
Incident rates: Ages 15-19figure 6.3, per million population, 1994-1998, unadjusted, by state Rate per million population USRDS
Pediatric incident rates: Whitesfigure 6.4, per million population, 1994-1998, unadjusted, by state Rate per million population USRDS
Pediatric incident rates: Blacksfigure 6.4, per million population, 1994-1998, unadjusted, by state Rate per million population USRDS
Pediatric incident rates: Native Americansfigure 6.4, per million population, 1994-1998, unadjusted, by state Rate per million population USRDS
Pediatric incident rates: Asiansfigure 6.4, per million population, 1994-1998, unadjusted, by state Rate per million population USRDS
Pediatric incident rates: Malesfigure 6.5, per million population, 1994-1998, unadjusted, by state Rate per million population USRDS
Pediatric incident rates: Femalesfigure 6.5, per million population, 1994-1998, unadjusted, by state Rate per million population USRDS
Pediatric incident rates: Diabetesfigure 6.6, per million population, 1994-1998, unadjusted, by state Rate per million population USRDS
Pediatric incident rates: Hypertensionfigure 6.6, per million population, 1994-1998, unadjusted, by state Rate per million population USRDS
Pediatric incident rates: Glomerulonephritisfigure 6.6, per million population, 1994-1998, unadjusted, by state Rate per million population USRDS
Pediatric incident rates: Cystic kidneyfigure 6.6, per million population, 1994-1998, unadjusted, by state Rate per million population USRDS
Pediatric incident rates: Other urologicfigure 6.6, per million population, 1994-1998, unadjusted, by state Rate per million population USRDS
Pediatric incident rates: Unknown causefigure 6.6, per million population, 1994-1998, unadjusted, by state Rate per million population USRDS
Number of pediatric patients, by gender, within primary diagnosis groupfigure 6.7, dialysis patients, 1994-1998 USRDS
Distribution of primary diagnosis within racial groupfigure 6.8, pediatric dialysis patients, 1994-1998 USRDS
Mean & median age within primary diagnosis groupfigure 6.9, pediatric dialysis patients, 1994-1998 USRDS
Number of patients, by gender, within primary diagnosis groupfigure 6.10, pediatric transplant patients, 1994-1998 USRDS
Distribution of primary diagnosis within racial groupfigure 6.11, pediatric transplant patients, 1994-1998 USRDS
Mean & median age within primary diagnosis groupfigure 6.12, pediatric transplant patients, 1994-1998 USRDS
Racial distribution within primary diagnosis groupfigure 6.13, pediatric dialysis patients, 1994-1998 USRDS
Racial distribution within primary diagnosis groupfigure 6.14, pediatric transplant patients, 1994-1998 USRDS
Gender distribution within primary diagnosis groupfigure 6.15, pediatric patients, 1994-1998 USRDS
Causes of renal failure within age groupfigure 6.16, pediatric incident patients, 1994-1998 USRDS
Treatment modality two years following ESRD onset, within race groupfigure 6.17, pediatric incident patients, 1994-1998 USRDS
Treatment modality two years following ESRD onset, within age groupfigure 6.18, pediatric incident patients, 1994-1998 USRDS
Total first transplants by donor source & yearfigure 6.19, pediatric patients USRDS
First transplant ratesfigure 6.20, pediatric patients, by age group & gender, 1996-1998 USRDS
First transplant ratesfigure 6.21, pediatric patients, by race & gender, 1996-1998 USRDS
Kaplan-Meier 5-year patient survivalfigure 6.22, pediatric incident patients, 1992-1993 USRDS
Kaplan-Meier 5-year patient survival after first transplantationfigure 6.23, pediatric cadaveric transplants, 1992-1993 USRDS
Kaplan-Meier 5-year patient survival after first transplantationfigure 6.24, pediatric living donor transplants, 1992-1993 USRDS
Kaplan-Meier 5-year graft survival after first transplantationfigure 6.25, pediatric cadaveric transplants, 1992-1993 USRDS
Kaplan-Meier 5-year graft survival after first transplantationfigure 6.26, pediatric living donor transplants, 1992-1993 USRDS
Total repeat pediatric transplants by donor source & yearfigure 6.27 USRDS
Pediatric first hospital admission ratesfigure 6.28, dialysis patients, 1996-1998 USRDS
Pediatric first hospital admission ratesfigure 6.29, hemodialysis patients, 1996-1998 USRDS
Pediatric first hospital admission ratesfigure 6.30, peritoneal dialysis, 1996-1998 USRDS
Pediatric admission rates: Hemodialysis, cardiovascular (overall)figure 6.31, per 100 patient years at risk, 1996-1998, by network Network 1 Rate per 100 patient years at risk Network 7 USRDS
Pediatric admission rates: Peritoneal dialysis, cardiovascular (overall)figure 6.31, per 100 patient years at risk, 1996-1998, by network Network 1 Rate per 100 patient years at risk Network 7 USRDS
Pediatric admission rates: Hemodialysis, infection (overall)figure 6.31, per 100 patient years at risk, 1996-1998, by network Network 1 Rate per 100 patient years at risk Network 7 USRDS
Pediatric admission rates: Peritoneal dialysis, infection (overall)figure 6.31, per 100 patient years at risk, 1996-1998, by network Network 1 Rate per 100 patient years at risk Network 7 USRDS
Pediatric admission rates: Hemodialysis, vascular access (overall)figure 6.31, per 100 patient years at risk, 1996-1998, by network Network 1 Rate per 100 patient years at risk Network 7 USRDS
Pediatric admission rates: Peritoneal dialysis, vascular access (overall)figure 6.31, per 100 patient years at risk, 1996-1998, by network Network 1 Rate per 100 patient years at risk Network 7 USRDS
Pediatric admission rates: Hemodialysis, vascular access infectionfigure 6.31, per 100 patient years at risk, 1996-1998, by network Network 1 Rate per 100 patient years at risk Network 7 USRDS