Download
1 / 10
100 likes | 229 Views
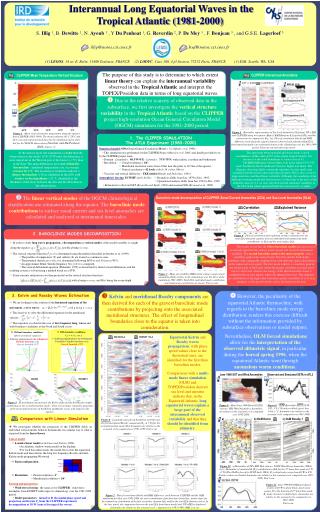
VSLS measurements in the tropical East Atlantic. Steffen Fuhlbrügge , Kirstin Krüger, Birgit Quack, Elliot Atlas, Helmke Hepach , Franziska Wittke and the DRIVE-Poseidon Team. DRIVE: HySplit 10-day backward trajectories. HySplit calculations -- start of the cruise -- end of the cruise.

E N D
VSLS measurementsin the tropical East Atlantic Steffen Fuhlbrügge, Kirstin Krüger, Birgit Quack, Elliot Atlas,Helmke Hepach, Franziska Wittkeandthe DRIVE-Poseidon Team
DRIVE: HySplit 10-day backward trajectories HySplit calculations --start of the cruise -- end of the cruise
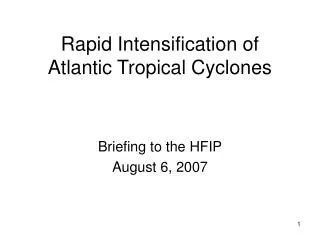
pmol(m²*hr) Leg 2 CHBr3: atmospheric concentration Leg 2 CHBr3: air-sea flux ppt Leg 3 CHBr3: atmospheric concentration ppt CHBr3: atmospheric concentrations [ppt] and air-sea flux (pmol/(m²*hr)] Air sample analysis: Elliot AtlasFlux calculations: Helmke Hepach, PhD thesis
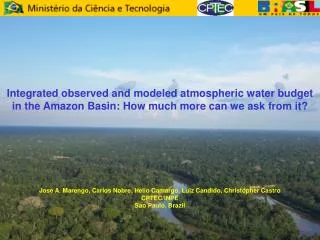
pmol(m²*hr) Leg 2 CH2Br2: atmospheric concentration Leg 2 CH2Br2: air-sea flux ppt Leg 3 CH2Br2: atmospheric concentration ppt CH2Br2: atmosphericconcentrations [ppt] andair-seaflux (pmol/(m²*hr)] Air sample analysis: Elliot AtlasFlux calculations: Helmke Hepach, PhD thesis
Leg 2 CH3I: atmospheric concentration ppt Leg 3 CH3I: atmospheric concentration ppt CH3I: atmosphericconcentrations [ppt] Air sample analysis: Elliot AtlasFlux calculations: Helmke Hepach, PhD thesis
Comparison/Correlation of trace gases and mixing layer height Correlations: CHBr3:MLH = -0.94CH2Br2:MLH = -0.94CH3I:MLH = -0.54 CHBr3:CH2Br2 = 0.97 CHBr3:CH3I = 0.69 CH3I:CH2Br2 = 0.74 Date = 24 h station
Air mass classification: Open ocean 5-day backward trajectories 1. station 2. station 3. station CHBr3
Air mass classification: Coast 1-day backward trajectories 4. station 5. station 6. station 1 CHBr3 ppt rwd = 0.85
Lower values ≈ younger sources = 24 h station