Download
1 / 4
40 likes | 45 Views
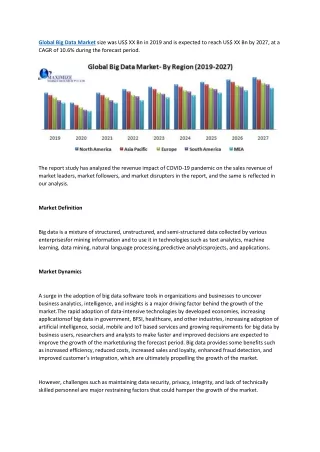
Explore the use of big data tools like satellite maps, LiDAR, and species occurrence data for biodiversity assessments at various scales. Utilize resources like GBIF and FIA databases to study forest health and plant communities.

E N D
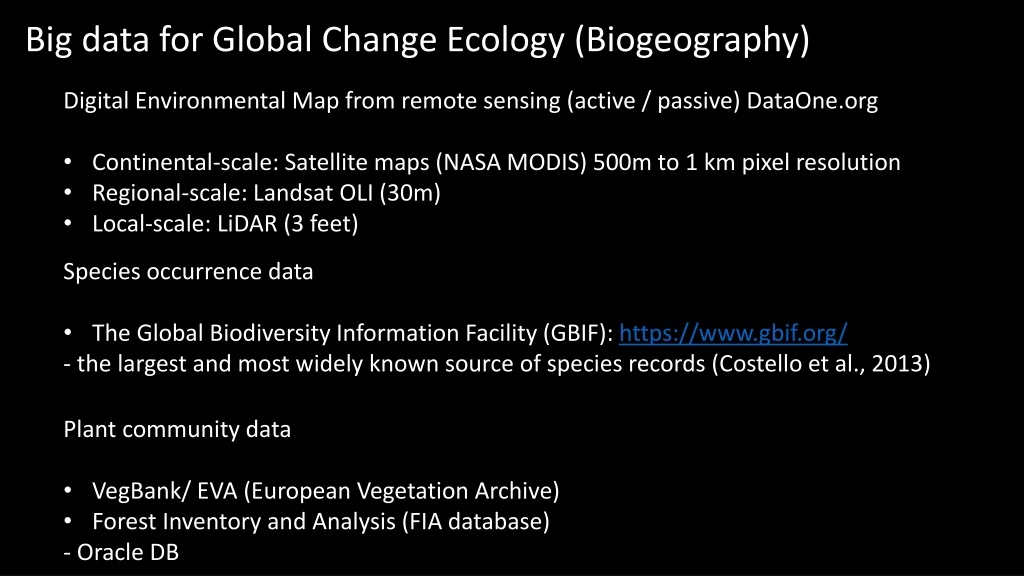
Big data for Global Change Ecology (Biogeography) • Digital Environmental Map from remote sensing (active / passive) DataOne.org • Continental-scale: Satellite maps (NASA MODIS) 500m to 1 km pixel resolution • Regional-scale: Landsat OLI (30m) • Local-scale: LiDAR (3 feet) • Species occurrence data • The Global Biodiversity Information Facility (GBIF): https://www.gbif.org/ • - the largest and most widely known source of species records (Costello et al., 2013) • Plant community data • VegBank/ EVA (European Vegetation Archive) • Forest Inventory and Analysis (FIA database) • - Oracle DB
Forest Inventory and Analysis (FIA) Sampling procedures: • Forest health • One plot per 96,000 acres (Every 16th phase 2 plot) • Ground plot • One plot per 6,000 acres • Remote sensing • Stratification Plot design:
Species Richness from FIA 1. Tally trees are from the four sub-plots: (i.e. all live trees with stems ≥12.7 cm in diameter measured at 1.4 m above ground). 2. All grids (50 km by 50 km) containing greater than 10 FIA plots were included to estimate species richness 3. For each grid, logarithmic functions developed between total number of species and number of plots 4. Then the estimates of species richness were standardized for one hectare (area equivalent to 17 FIA plots) based on the cell-specific slope and intercept of the logarithmic function.