Download
1 / 13
130 likes | 150 Views
Learn how to analyze international trade graphically, determine excess supply and demand, and understand the impacts on producers, consumers, agribusiness, and taxpayers. Explore trade concepts such as tariffs, subsidies, and quotas.

E N D
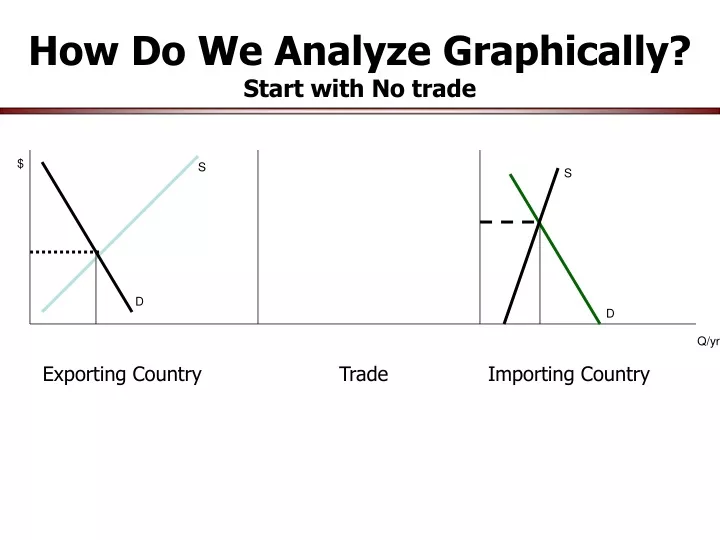
How Do We Analyze Graphically?Start with No trade $ S S D D Q/yr Exporting Country Trade Importing Country
How Do We Analyze Graphically?Next determine excess supply $ S S D D Q/yr Exporting Country Trade Importing Country
How Do We Analyze Graphically?Take same angle into trade sector Equal Distances $ S Excess Supply S D D Q/yr Exporting Country Trade Importing Country
How Do We Analyze Graphically?Next determine excess demand $ S Excess Supply S D D Q/yr Exporting Country Trade Importing Country
How Do We Analyze Graphically?Take same angle into trade sector $ S Excess Supply S Excess Demand D D Q/yr Exporting Country Trade Importing Country Equal Distances
International Trade $ S Excess Supply S Excess Demand D D Q/yr Exporting Country Trade Importing Country
How Do You Know if You Did It Right? $ S Excess Supply S Excess Demand D D Q/yr Exporting Country Trade Importing Country All three should be equal
What Can We Say About Impacts? $ S Excess Supply S Excess Demand D D Q/yr Exporting Country Trade Importing Country Producers Consumers Agribusiness Taxpayers Producers Consumers Agribusiness Taxpayers
International Trade Import Tariff $ S Excess Supply S Excess Demand D D Q/yr Exporting Country Trade Importing Country
International Trade Export Subsidy $ S Excess Supply S Excess Demand D D Q/yr Exporting Country Trade Importing Country
International Trade Import Quota $ S Excess Supply S Excess Demand D D Q/yr Exporting Country Trade Importing Country
International Trade Import Quota $ S Excess Supply S Excess Demand D D Q/yr Exporting Country Trade Importing Country
International Trade Import Quota $ S Excess Supply S Excess Demand D D Q/yr Exporting Country Trade Importing Country