Download
1 / 3
30 likes | 91 Views
Analyze and transform stimulus levels into pixel units, fit a logistic function, calculate PSA and PA values, and convert them to visual angle units using Whizgraph software.

E N D
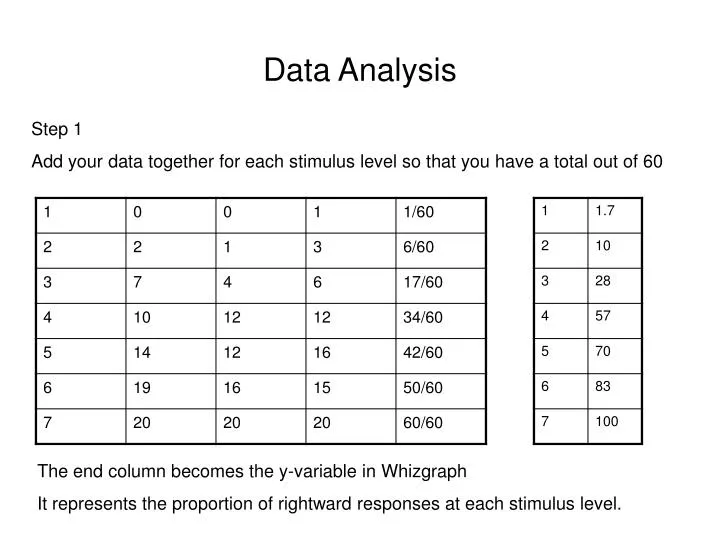
Data Analysis Step 1 Add your data together for each stimulus level so that you have a total out of 60 The end column becomes the y-variable in Whizgraph It represents the proportion of rightward responses at each stimulus level.
Data Analysis Step 2 Transform your stimulus levels to pixel units. A value of 4 = 0. Convention: left is negative and right is positive The transformed stimulus level becomes the x-variable in the Whizgraph
Data Analysis Step 3 Fit a Logistic function to your data using Whizgraph Y=100/1+e^(x-)/ Where y is the % of rightwards positional judgements, is the offset corresponding to the 50% level (i.e. the Point of Subjective Alignment (PSA)), and is an estimate of the alignment threshold (i.e. Positional Acuity (PA)). M1 - Point of Subjective Alignment (PSA) M2 - Positional Acuity (PA) Both of these values can be converted to units of visual angle by multiplying the value by the conversion factor. CV for WD of 57cms is 1.48422. CV for WD of 28.5.5cms is 2.96844. This will convert your PSA and PS measures to minutes of arc.