Download
1 / 21
230 likes | 438 Views
This guide provides an overview of 2D matrix and image processing using MATLAB. Learn to display, store, manipulate, and transform images. Get started with helpful tips, load data, and understand common image formats. Practical examples and functions included.

E N D
Introduction to Image Processing with MATLAB Oliver Wieben and Wally Block BME / Medical Physics 530 Medical Imaging Systems February 12th, 2002
Overview • Getting Help • 2D Matrix / Image • Coordinate system • Display • Storing images • 2D Functions • Discrete Fourier Transform • 1D DFT • fftshift • 2D DFT: zero-filling and shifting the image
Getting Started • Get a CAE account • Log in (Windows or Unix) • Create a directory ‘ImLab’ • Open Webbrowser and goto course page • http://zoot.radiology.wisc.edu/~block/bme_530.html • Goto ‘Lecture Material’ • Download • matlab_intro.m • example.fig, example.mat, example.tif • Start Matlab • Change to directory ‘Imlab’ • Either >>cd ImLab • Or use the path browser
Getting Help in Matlab • Online Help • Help Browser (? In toolbar or >>helpbrowser) • Help Functions ( >>help functionname) • Matlab website: www.mathworks.com • Demos • Documentation • Online as pdf files • Checkout at CAE
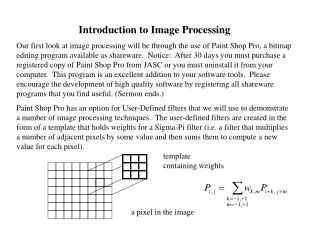
2D Matrix c • 2D matrix has M rows and N columns • Example • >>m=zeros(400,200); • >>m(1:50,1:100) = 1; • Note: • Index 1 to M, not 0 to M-1 • Origin of coordinate system is in upper left corner • Row index increases from top to bottom • Coordinate system is rotated in respect to ‘standard’ x-y coordinate system … 1 2 3 N 1 2 3 r … M
Image Display • Display a 2D matrix as an image • >>image(m) • >>imagesc(m) • >>imshow(m) • imshow is recommended by MATLAB for image processing • Image has MxN pixels = picture elements = dots on display • Test the following commands • >>axis on • >>colorbar • >>colormap(jet) • >>colormap(gray)
Image Types Medical images are mostly represented as grayscale images • Human visual system resolves highest spatial resolution for grayscale contrast • Color is sometimes used to superimpose information on anatomical data
Save Image Matrix • MATLAB binary format • >>save example m -> writes out example.mat • Standard image format (bmp,tiff,jpeg,png,hdf,pcx,xwd) • >>imwrite(m,’example.tif’,’tif’) -> writes out example.tif Warning: imwrite expects data in range [0…1] If data range outside this [0…1], use mat2gray >>m_2 = mat2gray(m); >>imwrite(m_2,’example.tif’,’tif’)
Save Figure (incl. labels etc) • Save in Matlab Figure Format: • >File>Save As> in Figure Window -> writes out example.fig • Standard image formats • >File>Export in Figure Window • E.g. jpg, tif, png, eps, … • Alternatively, use print, e.g. >>print –deps2 example.eps
Loading 2D Data and Images • Load matrix from MATLAB binary format • >>load example (loads example.mat) • Load matrix from standard image format • >>m_in = imread(’example.tif’,’tif’); • To check on an image: >>imfinfo(’example.tif’,’tif’) • Load figure from Matlab Figure Format (*.fig): • >File>Open> ‘example.fig’ in Figure Window ->Check loaded matrices • >>whos
Some Common Image Formats • TIF (TIFF) • Very common, compatible, all purpose image format • Allows for lossless compression • JPEG • Allows for lossy compression (small file size) • Very common for internet • PNG (portable network graphics) • My personal preference to save MATLAB images for importing into Microsoft docuuments such as Word • Dicom • THE medical imaging format • Lots of header information (patient name & ID, imaging parameters, exam date, …) can be stored • Allows for lossy and lossless compression • Not supported by MATLAB!!! • EPS (Encapsulated Postscript) • Graphics format rather than an image format • Great for best quality print results • Large file size
2D Functions • Create a matrix that evaluates 2D Gaussian: exp(-p/2(x2+y2)/s2) • >>ind = [-32:1:31] / 32; • >>[x,y] = meshgrid(ind,-1*ind); • >>z = exp(-pi/2*(x.^2+y.^2)/(.25.^2)); • >>imshow(z) • >>colorbar x y y’ -1 64x64 matrix x’ 0 31/32 -1
FT Conventions - 1D 1D Fourier Transform • >>l = z(33,:); • >>L = fft(l); abs (L) l phase (L) 1 33 64 1 33 64 sample # sample # 0 xmax 0 fN/2 fN x [Matlab] u
1D FT - fftshift Use fftshift • >>L1 = fft(fftshift(l)); abs (L1) l phase (L1) 1 33 64 1 33 64 sample # sample # 0 xmax 0 fN/2 fN x [Matlab] u
1D FT - 2xfftshift Center Fourier Domain • >>L2 = fftshift(fft(fftshift(l))); abs (L2) phase (L2) 1 33 64 sample # -fN/2 0 (N-1)/N*fN/2 u
fftshift in 2D Use fftshift for 2D functions • >>smiley2 = fftshift(smiley);
2D Discrete Fourier Transform • >>figure • >>imshow(imag(Z),[]) • >>colorbar • >>Z=fftshift(fft2(fftshift(z))); • >>whos • >>figure • >>imshow(real(Z)) • >>imshow(real(Z),[]) • >>colorbar Real (Z) Imag (Z)
2D DFT - Zero Filling Interpolating Fourier space by zerofilling in image space • >>z_zf = zeros(256); • >>z_zf(97:160,97:160) = z; • >>Z_ZF = fftshift(fft2(fftshift(z_zf))); • >>figure • >>imshow(abs(Z_ZF),[]) • >>colorbar • >>figure • >>imshow(angle(Z_ZF),[]) • >>colorbar Magnitude (Z_ZF) Phase (Z_ZF)
2D DFT - Voxel Shifts Shift image: 5 voxels up and 2 voxels left • >>z_s = zeros(256); • >>z_s(92:155,95:158) = z; • >>Z_S = fftshift(fft2(fftshift(z_s))); • >>figure • >>imshow(abs(Z_S),[]) • >>colorbar • >>figure • >>imshow(angle(Z_S),[]) • >>colorbar Magnitude (Z_S) Phase (Z_S)
Review of functions … • Input / Output • >>imread • >>imwrite • >>imfinfo • Image Display • >>imshow • Others • >>axis • >>colorbar • >>colormap • >>meshgrid • >>fft, fft2 • >>fftshift
More useful functions … • Image Display • >>title • >>xlabel, ylabel • >>subimage • >>zoom • >>mesh • Others • >>imresize • >>imrotate • >>imhist • >>conv2 • >>radon • >>roipoly • Demos in Image Processing Toolbox • >>help imdemos