Download
1 / 10
100 likes | 207 Views
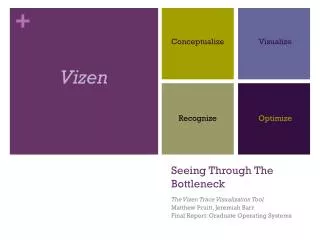
Conceptualize. Visualize. Vizen. Recognize. Optimize. Seeing Through The Bottleneck. The Vizen Trace Visualization Tool Matthew Pruitt, Jeremiah Barr Progress Report: Graduate Operating Systems. The Problem. The tool strace Copious amounts of data

E N D
Conceptualize Visualize Vizen Recognize Optimize Seeing Through The Bottleneck The Vizen Trace Visualization Tool Matthew Pruitt, Jeremiah Barr Progress Report: Graduate Operating Systems
The Problem • The tool • strace • Copious amounts of data • Difficult to read for users unfamiliar with the strace syntax • Visualizing The Trace • High dimensionality in the trace • Aggregating data from trace and other processes can cause high overhead open("/lib64/libdl.so.2", O_RDONLY) = 3 read(3, "\177ELF\2\1\1\0\0\0\0\0\0\0\0\0\3\0>\0\1\0\0\0\20\16\30040\0\0\0"..., 832) = 832 fstat(3, {st_mode=S_IFREG|0755, st_size=23360, ...}) = 0 mmap(0x3034c00000, 2109696, PROT_READ|…
The Solution • Abstraction • Create multiple views showing key points in the data • Allows users to see connections between trace data and various aspects of system performance • Users can drill down to pertinent information • Allows user to easily filter the large amounts of data generated by strace • Difficulties • Combining strace with system performance measurements • Maintaining low overhead • Displaying data in such a way that the user can quickly and intuitively see bottlenecks
The Diagram of The Solution strace /proc VFS JProcExplorer JProcessParser JTraceDataModel JPerfDataModel JGanttChart JXYPlot JBarChart JGlobalView Vizen
Future Plans • Visualizations • System Calls/Second • Gantt Chart • Etc… • Program Components • Hook views together • Improve interactive functionality • Performance • Improve program performance by removing calls to outside programs • Use /proc virtual file system