Download
1 / 12
120 likes | 268 Views
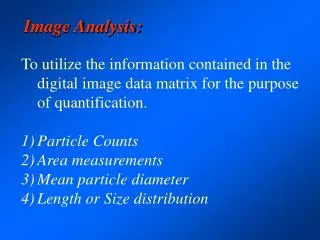
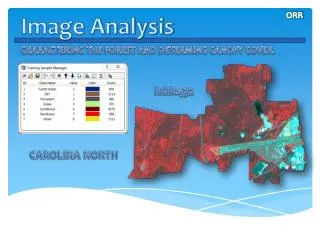
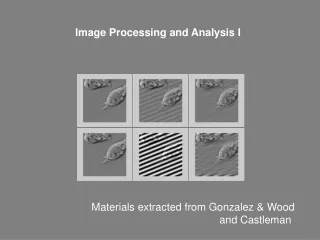
Image Analysis I. Biology UNI 2005. What is image analysis?. Start with image (digital) Cell through microscope Forest from satellite Any scale in between Determine properties of image Dimensions Color Presence of tagged (marked) items Counts of particles by size Movement, path length.

E N D
Image Analysis I Biology UNI 2005
What is image analysis? • Start with image (digital) • Cell through microscope • Forest from satellite • Any scale in between • Determine properties of image • Dimensions • Color • Presence of tagged (marked) items • Counts of particles by size • Movement, path length
Why use image analysis? • Convenient • When you want • Where you want • Time not a problem • Capture a “snapshot” in time • Analyze it later for multiple things • Can learn more than every before
Poor man’s example • Lines and shapes • From PPT • Connect two spots • Format Autoshape/Size • Size gives length of line • Make a box or oval that just covers the item you want to know about • Format Autoshape/Size • Size gives height, width • Formulas give other dimensions
Scaling • Usually want to know size of item on image, not screen • Need something in image that gives scale • Often a ruler or scale bar (microscopes) • Measure image of scale (inches, cm, pixels) • Measure item of interest • Convert item of interest to real units
What is cell diameter? • 100 µm bar is • Right click/Format/Size • 3” on screen • 3” = 100 µm • 1” = 33.3 µm (get this form) • Cell is 2” on screen • Right click/Format/Size • 2” x 33.3 µm/” = 66.6 µm 100 µm cell
Caution and scales • Scale and image of interest must be • Together in original image • Or taken at same magnification • At the same distance from the camera • Common types of scale • Electron microscope: automatic • Microscope: scale on stage • Camera: ruler or meter stick in original image • Airplane, satellite: know distances between items
Examples to try #1 How tall is the tree from its visible base (pretend it is on the sled)? Dad is 6’ tall. What is the problem with measuring house height here from 6’ tall George?
Examples to try #2 How far apart are these two nucleoli (center to center)? Scale bar is 65 µm. The peak on the right is 1250 m higher than the one on the left, and they are at equal distance from the camera. How far apart (as the crow flies) are the summits?
Conversion help • Doing just a few? • Set up neatly on paper • Calculator • Or do in your head • More than three? Excel • Yellow cells = formulas • Check first by hand? 100 µm cell
Limitations to this method • Only a few types of measurement • Not angle • Not circumference • Not density • Can’t handle irregular shapes, paths • Time to do it as the big boys and girls do
Image analysis programs • Several out there • Biologists’ favorite: NIH Image/Scion Image • Mac/PC • Macs generally better for images (design) • PCs OK now • Free download • Google: Scion Image/Download • Your tax dollars developed • Manual included, but other help not given • Download site run by frame grabber board company