Download
1 / 7
70 likes | 186 Views
Visualization Pipelines for Geo-simulations. Antônio José da Cunha Rodrigues Tiago Garcia de Senna Carneiro* TerraLAB – Laboratory for Earh System Modeling and Simulation Computer Science Department Federal University of Ouro Preto GeoInfo 2013. Massive volume of data.

E N D
Visualization Pipelines for Geo-simulations Antônio José da Cunha Rodrigues Tiago Garcia de Senna Carneiro* TerraLAB – Laboratory for Earh System ModelingandSimulation ComputerScienceDepartment Federal Universityof Ouro Preto GeoInfo 2013
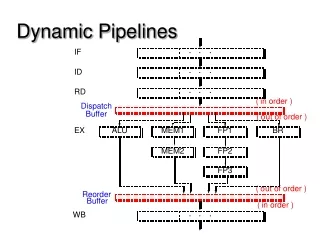
O conceito de pipelines Adaptado de Wood et al. (2005) • Visualizationside: • Visualization toolkit memory space • Simulationside: • Script languagesmemory space Data Acquisition Data Transmission Visual Mapping Rendering Display Imagens Compressing protocol Sendonly changes Cache memory Renderingonlychanges Multitaskpipeline
averageresponse time 3500 Total Aquisição Decodificação 3000 Espera 2531.704 Mapeamento visual 2500 Renderização Exibição 2000 1.271e+03 time (ms) 1500 1254.169 2.992e+02 3.931e+02 1000 1.251e+02 617.945 555.901 500 3.043e+02 8.421e+02 8.052e+02 3.094e+02 1.331e+02 7.121e+01 1.197e+02 1.149e+02 2.255e+01 2.309e+01 5.569e+01 0 5.520e+01 no cache • cache + multitask + cache cache + multitask protocol Results –32 bits in windows
AverageResponse Time 300 100% Mudanças 253.658 252.510 50% Mudanças 250 200 156.296 124.998 time (ms) 150 100 60.218 61.277 28.182 50 20.925 27.537 21.395 0 MASON NetLogo Repast-Java Repast-ReLogo TerraME Results – SeveralModelingPlatforms
Discussion • Acquiring data from script language memory space is still the system bottleneck • Contradictoryresultsbetweenimplementations: • 32versus64 bits • LinuxversusWindows