Download
1 / 15
150 likes | 351 Views
Methods of Deriving Biometric Receiver Operating Characteristic Curves from the Nearest Neighbor Classifier. Robert Zack dissertation work Also see Pace University CSIS Technical Report No. 268, November 2009 PDF Version. Receiver Operating Characteristic (ROC) Curves – A Quick Review.

E N D
Methods of Deriving Biometric Receiver Operating Characteristic Curves from the Nearest Neighbor Classifier • Robert Zack dissertation work • Also see • Pace University CSIS Technical Report No. 268, November 2009 • PDF Version Biometric ROC Curves
Receiver Operating Characteristic (ROC) Curves – A Quick Review • Used for binary decisions • Signal detection – signal / no signal • Medical diagnosis – disease / no disease • Biometric authentication – you are the person you claim to be / you are not • In biometrics the ROC curve varies from FAR=1 & FRR=0 at one end to FAR=0 & FRR=1 at other • FAR = False Accept Rate – the rate an imposter is falsely accepted • FRR = False Reject Rate – the rate the correct person is falsely rejected Biometric ROC Curves
Standard Biometric ROC Curve Biometric ROC Curves
ROC curves easily obtained from parametric classification techniques As t varies from 0 to infinity. For a specific t, you get a specific point on the ROC. FAR varies from 0 to 1 and FRR from 1 to 0 Biometric ROC Curves
Nearest Neighbor Non-Parametric Classification Technique • Makes no assumptions about the data • Data are not drawn from or fitted to probability distributions • Test samples are classified based on distances to training samples • No standard method of obtaining ROC curves Biometric ROC Curves
Nonparametric - k Nearest Neighbor (kNN) Pattern Classification Procedure • Underlying prob. density function is: • unknown and no form assumed • Go directly to decision a function • here k=5 • Use odd numbers and take the majority • Now, how can we get ROC curve? Biometric ROC Curves
Vector Difference Authentication Model • Transforms biometric samples from a many-class problem feature space into a two-class problem in feature-distance space Biometric ROC Curves
ROC Curve Derivation fromm-matching, k Nearest Neighbors • Two procedures: vary m from 0 to infinity • Unweighted m-match kNN (m-kNN) • equal weight on all within-class matches • Weighted m-match kNN (wm-kNN) • heavier weights applied to closer matches • first investigated linear weighting • k, k-1, k-2, …, 1 Biometric ROC Curves
ROC Curve Derivation from unweightedm-matching, k Nearest Neighbors W=Within B=Between • Authenticate if m of the kNN within-class. • m varies from 0 to k for points on ROC curve. • All W’s are equal in weight. • If m=0, all users accepted (FAR=1,FRR=0) • If m=7, few users accepted (FAR=small, FRR=large). Biometric ROC Curves
ROC Curve Derivation from weightedm-matching, k Nearest Neighbors • Authenticate if W choices > weighted match (m) • m varies from 0 to n • n= k(k+1)/2. Here, 7+6..+1=28 • weights of m vary from 7 to 1, with the closest having the highest weight. • For every m, you have a FAR/FRR pair on ROC curve • If n=0, all users accepted (FAR=1,FRR=0) • If n=28, few users accepted FAR=small and FRR=large Biometric ROC Curves
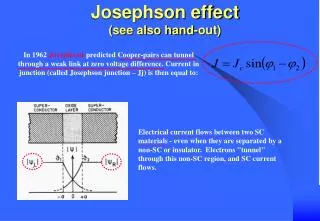
FAR and FRR versus threshold m for unweightedm-kNN procedure for k = 10 DeskCopy (left) and LapFree (right) plots of FAR and FRR versus the threshold m for the unweighted m-kNN procedure for k = 10. Biometric ROC Curves
Keystroke Biometric ROC curves: unweighted and weighted methods for k = 10, 15, 20 Biometric ROC Curves
ROC Curve Derivation using Distance Threshold from Questioned Sample • When t = 0, no user authenticated, at ∞ all users authenticated • Threshold t starts at 0, increments by 0.1, data exhausted at t=5 • EER is about 15 at t=2 • Key Finding: threshold method performs poorly Biometric ROC Curves
ROC Curve Derivation using Distance Threshold from Questioned Sample Biometric ROC Curves
Future Work • Investigate two types of enrollment • Weak enrollment (for which the system was designed) – the individuals being tested are not part of the training (initial enrollment) group, although reference enrollment samples are used in the authentication process • Strong enrollment – the individuals being tested are part of the training (initial enrollment) group, and additional reference (enrollment) samples are used in the authentication process Biometric ROC Curves