Download
1 / 13
130 likes | 222 Views
Section 5.2. Normal Distributions: Finding Probabilities. Section 5.2 Objectives. Find probabilities for normally distributed variables. μ = 500 σ = 100. P ( x < 600) = Area. x. μ = 500. 600. Probability and Normal Distributions.

E N D
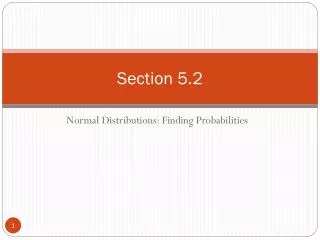
Section 5.2 Normal Distributions: Finding Probabilities
Section 5.2 Objectives • Find probabilities for normally distributed variables
μ = 500 σ = 100 P(x < 600) = Area x μ = 500 600 Probability and Normal Distributions • If a random variable x is normally distributed, you can find the probability that x will fall in a given interval by calculating the area under the normal curve for that interval.
Probability and Normal Distributions Normal Distribution Standard Normal Distribution μ = 500 σ = 100 μ = 0 σ = 1 P(x < 600) P(z < 1) z x Same Area μ =500 600 μ = 0 1 P(x < 600) = P(z < 1)
Example: Finding Probabilities for Normal Distributions A survey indicates that people use their cellular phones an average of 1.5 years before buying a new one. The standard deviation is 0.25 year. A cellular phone user is selected at random. Find the probability that the user will use their current phone for less than 1 year before buying a new one. Assume that the variable x is normally distributed.
Standard Normal Distribution μ = 1.5 σ = 0.25 μ = 0 σ = 1 P(z < –2) P(x < 1) 0.0228 z x 1 1.5 –2 0 Solution: Finding Probabilities for Normal Distributions Normal Distribution P(x < 1) = 0.0228
Example: Finding Probabilities for Normal Distributions A survey indicates that for each trip to the supermarket, a shopper spends an average of 45 minutes with a standard deviation of 12 minutes in the store. The length of time spent in the store is normally distributed and is represented by the variable x. A shopper enters the store. Find the probability that the shopper will be in the store for between 24 and 54 minutes.
P(–1.75 < z < 0.75) P(24 < x < 54) x z –1.75 24 45 0 Solution: Finding Probabilities for Normal Distributions Normal Distributionμ = 45 σ = 12 Standard Normal Distributionμ = 0 σ = 1 0.0401 0.7734 54 0.75 P(24 < x < 54) = P(–1.75 < z < 0.75) = 0.7734 – 0.0401 = 0.7333
Example: Finding Probabilities for Normal Distributions If 200 shoppers enter the store, how many shoppers would you expect to be in the store between 24 and 54 minutes? Solution: Recall P(24 < x < 54) = 0.7333 200(0.7333) =146.66 (or about 147) shoppers
Example: Finding Probabilities for Normal Distributions Find the probability that the shopper will be in the store more than 39 minutes. (Recall μ = 45 minutes and σ = 12 minutes)
P(z > –0.50) P(x > 39) x z 39 45 0 Solution: Finding Probabilities for Normal Distributions Normal Distributionμ = 45 σ= 12 Standard Normal Distributionμ = 0 σ = 1 0.3085 –0.50 P(x > 39) = P(z > –0.50) = 1– 0.3085 = 0.6915
Example: Finding Probabilities for Normal Distributions If 200 shoppers enter the store, how many shoppers would you expect to be in the store more than 39 minutes? Solution: Recall P(x > 39) = 0.6915 200(0.6915) =138.3 (or about 138) shoppers
Section 5.2 Summary • Found probabilities for normally distributed variables