Download
1 / 18
180 likes | 301 Views
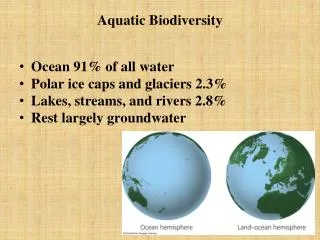
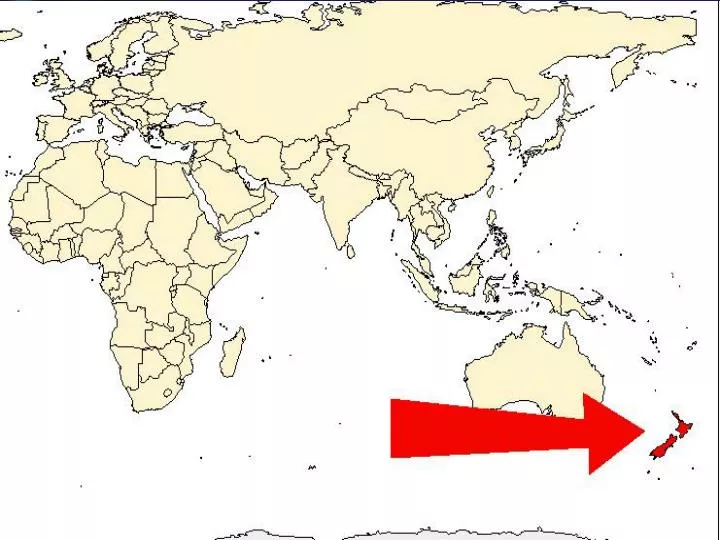
Development of a National Aquatic Biodiversity Information System for New Zealand. Jacqui Burgess Senior Scientist Ministry of Fisheries New Zealand. New Zealand Biodiversity Strategy. Responding to a decline in indigenous biodiversity Key component of vision:

E N D
Development of a National Aquatic Biodiversity Information System for New Zealand Jacqui Burgess Senior Scientist Ministry of Fisheries New Zealand
New Zealand Biodiversity Strategy • Responding to a decline in indigenous biodiversity • Key component of vision: • Biodiversity is valued and better understood • $ NZ1.4 m to improve understanding of marine biodiversity
Marine Biodiversity Research Programme • Aims to improve understanding of NZ marine biodiversity by: • Improving information management • Increasing knowledge of communities • Three project areas: • Marine communities in NZ waters • Marine communities in Ross Sea, Antarctica • National Aquatic Biodiversity Information System (NABIS)
What will NABIS do? • Provide free access to information about the marine environment via an Internet based GIS • Add value to existing data by transforming it into information • Enable users to query information, discover data sources and produce maps • Improve geospatial data management and apply common standards
Evolution of NABIS • Consultation • Decisions decisions decisions • More consultation • Hard decisions made • Ready to go after 2 years!
Initial Consultation Process • Individual interviews • Discussion paper
Key Outcomes of Consultation • Need information not data • People do not have skills to interrogate or interpret distributed databases • Managers need information for quick decision making (not data) • Improved access to information will lead to better decision making
Information vs Data Information: • Is derived from some form of data analysis • May be derived from a variety of data sources • Avoids complications surrounding ownership of data • Avoids misinterpretation of data points
But what information? • Newsletter • Questionnaire
Base information layers • Coastline • NZ EEZ • Place names (Town, city, port location) • NZ 12 nautical mile limit • Fisheries administrative boundaries
High priority information layers Species distributions/ranges Fisheries catch Breeding colonies/areas Bathymetry Aquaculture Marine Protected Areas
Presentation of Information EXAMPLE 1: • Fisheries catch by Fisheries Management Area • Combined data from all vessels fishing for stated species over a particular period of time • Attribute data available for each FMA may include: tonnes, effort, fishing methods etc
Presentation of Information EXAMPLE 2: • Species distribution • May combine data from a number of databases holding information on distribution of stated species • Metadata may include: data sources, data owners, data managers, etc
Presentation of Information EXAMPLE 3: • Position of marine farms • Data source local government, verified on site • Attribute data may include: Farm name, Farm owner, species farmed, reliability of position, etc
Process for Development NABIS will be delivered in two distinct phases : • Phase 1 Prototype Implementation (early 2003) • Phase 2 Full Implementation (late 2003)
Bridges yet to cross… • Sourcing relevant data for information layers • Final decisions on functionality of system • Metadata standards • Managing stakeholder expectations
Acknowledgments • David Prentice (Project Manager) • Pete Smith (System Developer) • NIWA (photos of NZ & Ross Sea marine biodiversity) Future updates on NABIS at: www.fish.govt.nz