Download
1 / 66
840 likes | 2.89k Views
BASICS OF WAVEFORM INTERPRETATION. RET 2284 Principles of Mechanical Ventilation. Objectives. Identify graphic display options provided by mechanical ventilators. Describe how to use graphics to more appropriately adjust the patient ventilator interface. Introduction.

E N D
BASICS OF WAVEFORM INTERPRETATION • RET 2284 • Principles of Mechanical Ventilation
Objectives • Identify graphic display options provided by mechanical ventilators. • Describe how to use graphics to • more appropriately adjust the patient ventilator interface.
Introduction • Monitoring and analysis of graphic display of curves and loops during mechanical ventilation has become a useful way to determine not only how patient are being ventilated but also a way to assess problems occurring during ventilation.
Uses of Flow, Volume, and Pressure Graphic Display • Confirm mode functions • Detect auto-PEEP • Determine patient-ventilator synchrony • Assess and adjust trigger levels • Measure the work of breathing • Adjust tidal volume and minimize overdistension • Assess the effect of bronchodilator administration • Detect equipment malfunctions • Determine appropriate PEEP level
Uses of Flow, Volume, and Pressure Graphic Display • Evaluate adequacy of inspiratory time in pressure control ventilation • Detect the presence and rate of continuous leaks • Assess inspiratory termination criteria during Pressure Support Ventilation • Determine appropriate Rise Time
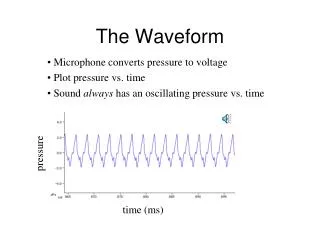
Measured Parameters • Flow • Pressure • Volume • Time
Pressure vs. Time Flow vs. Time Volume vs. Time Most Commonly Used Waveforms (Scalars)
30 A B C PIP Baseline Paw Mean Airway Pressure cmH2O Sec 1 2 3 4 5 6 -10 Pressure vs. TimeCurve
Pressure-Time Curve 20 Volume Ventilation Pressure Ventilation Paw cmH2O Sec 1 2 3 4 5 6
Patient Triggering 30 Paw cmH2O Sec 1 2 3 4 5 6 -10
Adequate Flow During Volume-Control Ventilation 30 Adequate flow P aw Time (s) cmH2O 1 2 3 -10
Flow set too low Inadequate Flow During Volume-Control Ventilation 30 Adequate flow P aw Time (s) cmH2O 1 2 3 -10
Patient/Ventilator SynchronyVolume Ventilator Delivering a Preset Flow and Volume Adequate Flow Paw Sec cmH2O 1 2 3 4 5 6 -20
Patient/Ventilator SynchronyThe Patient Outbreathing the Set Flow Air Starvation Paw Sec cmH2O 1 2 3 4 5 6 -20
Plateau Time 30 Inadequate plateau time Paw SEC cmH2O 1 2 3 4 5 6 -20
Plateau Time 30 Adequate Plateau Time Paw SEC cmH2O 1 2 3 4 5 6 -20
Flow vs.Time Curve 120 INSP Inspiration . V SEC LPM 1 2 3 4 5 6 EXH 120
Flow vs.Time Curve 120 INSP Inspiration . V SEC LPM 1 2 3 4 5 6 Expiration EXH 120
Flow vs.Time Curve Constant Flow Descending Ramp 120 INSP Inspiration . V SEC LPM 1 2 3 4 5 6 EXH 120
Flow-Time Curve 120 INSP . Insp. Pause V SEC LPM 1 2 3 4 5 6 Expiration EXH 120
Expiratory Flow Rate and Changes in Expiratory Resistance 120 . SEC V LPM 1 2 3 4 5 6 -120
A Higher Expiratory Flow Rate and a Decreased Expiratory Time Denote a Lower Expiratory Resistance 120 . SEC V LPM 1 3 4 5 6 2 120
Obstructed Lung Delayed flow return
Pressure-Time and Flow-Time Curves 20 Volume Ventilation Paw • Expiration cmH2O Sec 1 2 3 4 5 6 . V
Pressure-Time and Flow-Time CurvesDifferent Inspiratory Flow Patterns 20 Volume Ventilation Paw • Expiration Inspiration cmH2O Sec 1 2 3 4 5 6 . V
Pressure-Time and Flow-Time Curves 20 Pressure Ventilation Volume Ventilation Inspiratory Time Paw cmH2O Sec 1 2 3 4 5 6 . V
Rise Time How quickly set pressure is reached
Flow Acceleration Percent Rise Time Minimal Pressure Overshoot P Slow rise Moderate rise Fast rise . V Pressure Relief Time
Patient / Ventilator SynchronyVolume Ventilation Delivering a Preset Flow and Volume 30 Adequate Flow Paw Sec cmH2O 1 2 3 4 5 6 -20
Patient -Ventilator SynchronyThe Patient Is Outbreathing the Set Flow 30 Air Starvation Paw Sec cmH2O 1 2 3 4 5 6 -20
If Peak Flow Remains the Same, I-Time Increases: Could Cause Asynchrony 120 . V SEC LPM 1 2 3 4 5 6 -120
Changing Flow Waveform in Volume Ventilation: Effect on Inspiratory Time 120 . V SEC LPM 1 2 3 4 5 6 -120
Increased Peak Flow: Decreased Inspiratory Time 120 . V SEC LPM 1 2 3 4 5 6 -120
Detecting Auto-PEEP 120 . V SEC LPM 1 2 3 4 5 6 Zero flow at end exhalation indicates equilibration of lung and circuit pressure -120 Note: There can still be pressure in the lung behind airways that are completely obstructed
Detecting Auto-PEEP 120 . V SEC LPM 1 2 3 4 5 6 The transition from expiratory to inspiratory occurs without the expiratory flow returning to zero 120
800 ml Inspiration VT SEC 1 2 3 4 5 6 Volume vs.Time Curve
Volume vs.Time Curve 800 ml • Expiration VT SEC 1 2 3 4 5 6
Typical Volume Curve I-Time E-Time 1.2 A B VT Liters SEC 1 2 3 4 5 6 -0.4 A = inspiratory volume B = expiratory volume
Leaks 1.2 A VT Liters SEC 1 2 3 4 5 6 -0.4 A = exhalation that does not return to zero
VT . VLPM Setting Appropriate I-Time 600 cc 450 cc SEC 0 1 2 3 4 5 6 120 SEC 1 2 3 4 5 6 120
VT . VLPM Setting Appropriate I-Time 600 cc 450 cc 500 cc SEC 0 1 2 3 4 5 6 120 Lost VT SEC 4 1 2 3 5 6 120
Loops • Pressure-Volume Loops • Flow-Volume Loops
VT LITERS 0.6 0.4 0.2 Paw cmH2O -60 40 20 0 20 40 60 Pressure-Volume Loop
VT LITERS 0.6 0.4 Inspiration 0.2 Paw cmH2O -60 40 20 0 20 40 60 Mandatory Breath
Mandatory Breath VT Counterclockwise LITERS 0.6 • Expiration 0.4 Inspiration 0.2 Paw cmH2O -60 40 20 0 20 40 60
Spontaneous Breath VT Clockwise LITERS 0.6 0.4 Inspiration 0.2 Paw cmH2O -60 40 20 0 20 40 60
Spontaneous Breath VT Clockwise LITERS 0.6 0.4 Inspiration Expiration 0.2 Paw cmH2O -60 40 20 0 20 40 60
Work of Breathing VT LITERS 0.6 0.4 0.2 Paw 60 40 -60 -20 20 0 -40 cmH2O