Download
1 / 30
300 likes | 518 Views
HIRS Upper Tropospheric Humidity and Humidity Profiles. Lei Shi NOAA National Climatic Data Center Asheville, NC, U.S.A. Outline of Upper Tropospheric Humidity. Motivation for intersatellite calibration Time series discontinuity from satellite to satellite, particularly from HIRS/2 to HIRS/3

E N D
HIRS Upper Tropospheric Humidity and Humidity Profiles Lei Shi NOAA National Climatic Data Center Asheville, NC, U.S.A.
Outline of Upper Tropospheric Humidity • Motivation for intersatellite calibration • Time series discontinuity from satellite to satellite, particularly from HIRS/2 to HIRS/3 • Upper tropospheric water vapor (UTWV) is an important fundamental climate data record (CDR) • UTWV is a key component to water vapor feedback • Approach • Intersatellite calibration based on overlaps of zonal means • Result to achieve • Extended time series of the fundamental CDR to present
Motivation – Uncorrected Intersatellite Differences of UTWV (Channel 12) HIRS/2 Start of HIRS/3 • Due to the independence of individual HIRS instrument’s calibration, biases exist from satellite to satellite. • These intersatellite biases have become a common source of uncertainty faced by long-term studies.
Spectral Filter Functions • Differences between HIRS/2 and HIRS/3 are expected due to different filter functions. • In-orbit performance still has biases unexplained by filter functions. • Thus empirical approach is considered.
Temperature-dependent Intersatellite Differences from Zonal Mean Approach • More than half of satellites have bias variations larger than 0.5 K.
Intersatellite Calibrated to N-12(showing clear-sky 30S – 30N) • Biases minimized. • Temperature dependent biases accounted for. • Similar overall variances between HIRS/2 and HIRS/3/4. • Time series can be extended as variance preserved.
Climatologic Mean for Jan, Apr, Jul, and Oct January April July October
Climatological Monthly Mean and Variance • There are two peaks of mean UTWV brightness temperatures in 30N-30S, one in winter (January) and another one in summer (June). • During these two seasons the subtropics are dominated by a belt of strong subsidence (in northern hemisphere during winter and in southern hemisphere during summer). • The lows of the UTWV brightness temperatures are found in April and November, indicating weaker descending branch of the general circulation during spring and fall. • Large variances occur during the winter and early spring months.
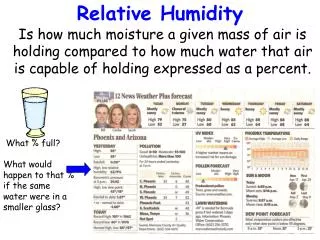
Upper Tropospheric Humidity For an easier comparison of UTWV with other conventional observations, Soden and Bretherton [1993] derived a formula to calculate the upper tropospheric humidity (UTH) based on UTWV brightness temperature as UTH = cos(θ)exp(31.5-0.115Tb) (1) In which Tb is the brightness temperature of HIRS channel 12 and θ is the satellite zenith angle.
Time Series of High and Low UTH • There are usually two peaks of large area coverages in a year, one in summer and another one in winter. • The area peaks of large UTH values and small UTH values usually occur in the same month, indicating when there are large organized convections in some parts of tropics, there are enhanced descending areas in other parts of the tropics.
Trends of high and low UTH • There is an increase of 2.6 grids/yr for the area with UTH values greater the 40%, and an increase of 2.2 grids/yr in the area of UTH with values less than 20%. • The long-term area increases in both high and low UTH values reveal the likelihood of enhanced convective activities in the tropics.
Monitoring Tropical Waves MJO ER
Monitoring Tropical Waves Madden-Julian oscill. Kelvin waves Eq. Rossby waves
Outline of Humidity Profile • Inter-satellite calibration. • Neural network scheme for deriving temperature and water vapor profiles. • Comparisons with surface observations.
High-Resolution Infrared Radiation Sounder (HIRS)/3 Spectral Characteristics.
Non-Inter-calibrated Clear-sky HIRS Channel Brightness Temperatures CH 2 CH 6 CH 11 CH 8
Non-Inter-calibrated Clear-sky HIRS Channel-5 Brightness Temperatures
Simultaneous Nadir Overpass (SNO) http://www.orbit.nesdis.noaa.gov/smcd/spb/calibration/intercal/
CO2 Increase From : http://scrippsco2.ucsd.edu/images/graphics_gallery/original/mlo_record.pdf
CO2 Impact • Averaged from Tb’s derived from 13,459 global profiles. • The only variable changed in the simulation is CO2 amount. • For mid-tropospheric channels (channels 4-6), this means if there were no temperature change in the past 30 years, one would see decrease in the observed Tb’s. • It is important to consider CO2 impact in the retrieval!
Statistics of Training Data Temperature Specific Humidity (K) (g/kg) Training data: A diverse sample of ECMWF profiles selected from the 1st and 15th of each month between January 1992 and December 1993 (Chevallier, 2001)
Model Simulation • RTTOV-9 is used to simulate HIRS channel brightness temperatures. • Advantage: model simulation of CO2 effect. • Disadvantage: relationship can be affected by errors in pre-launch instrument measurements and model errors. However, the errors can be reduced by adjustment to observations (for example, adjusted to co-located HIRS and homogenized radiosonde samples). • The selected profiles and corresponding HIRS brightness temperatures are randomly divided into three data sets: - 60% training set - 20% testing set - 20% independent validation set
Neural Network • Separate neural networks for temperature and water vapor. • Input: HIRS channels 2-12 and CO2 concentration. • Output: Tskin, Ta, and temperature profiles from 1000 to 50 hPa and water vapor profiles from 1000 to 300 hPa.
Comparisons of Retrievals with and without HIRS Inter-satellite Calibration
Comparison with Drifting and Moored Buoy Observations Drifting Moored
Conclusions • Upper Tropospheric Humidity based on almost-all-sky data • Temperature dependent inter-calibration • Extension of time series to current • HIRS/2 and HIRS/3 series connected • 30 years of global data • Humidity Profiles based on clear-sky data • The HIRS data are intersatellite-calibrated using data from simultaneous nadir observations (SNOs). • CO2 effect needs to be considered in the retrieval scheme. • A temperature and specific humidity retrieval scheme is developed based on neural network technique. • The retrievals are consistent with sea surface observations. Comparisons with land surface observations and with profile observations are being planned.