Download

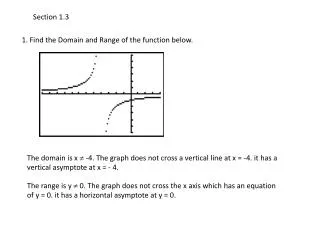
1 / 11
110 likes | 202 Views
Section 1.3 Notes. Organizing Data. EQ?. 1.3 ORGANIZING DATA. Presenting Scientific Data Even though scientists organize their data, they use graphs to show their results. Types of Graphs: Line Graphs: S how continuous change

E N D
Section 1.3 Notes Organizing Data
EQ? 1.3 ORGANIZING DATA • Presenting Scientific Data • Even though scientists organize their data, they use graphs to show their results. • Types of Graphs: • Line Graphs: Show continuous change • Independent Variable – You chose the interval to take measurements (and it is shown on the x-axis) • Dependent Variable – What happens in the experimentwhen you take data (and it is shown on the y-axis) • Bar Graphs: Compare the values of items • Pie Graphs: Show parts of a whole INSERTPICTURE
EQ? 1.3 ORGANIZING DATA • Scientific Notation • To reduce the number of zeros in very big and very small numbers, you can express the values as simple numbers multiplied by a power of 10. • Some powers of 10 and their decimal equivalents: • Example:34 000 = 3.4 x 10⁴ INSERTPICTURE
EQ? 1.3 ORGANIZING DATA • Using Significant Figures • Significant figures are a prescribed decimal place that determines the amount of rounding off to be done based on the precision of the measurement • Scientist use significant figures to show the precision of a measured quantity. • Precision is the exactness of a measurement • Accuracy is a description of how close a measurement is to the true value of the quantity measured. INSERTPICTURE
EQ? 1.3 ORGANIZING DATA • Good Accuracy: near the center • Good Precision: close together INSERTPICTURE
EQ? 1.3 ORGANIZING DATA • Good Accuracy: near the center • Poor Precision: spread apart INSERTPICTURE
EQ? 1.3 ORGANIZING DATA • Poor Accuracy: far from center • Good Precision: close together INSERTPICTURE
EQ? 1.3 ORGANIZING DATA • Poor Accuracy: far from center • Poor Precision: spread apart INSERTPICTURE
EQ? 1.3 ORGANIZING DATA • Significant Figures • Nonzero Digit: Always significant8675319: 7 sig figs • Leading Zero: Never significant0.00025: 2 sig figs • Captured Zero: Always significant401: 3 sig figs • Trailing Zero: Only significant if there isa decimal.1000 : 1 sig fig1000. : 3 sig figs0.100 : 2 sig figs1.000000 : 7 sig figs INSERTPICTURE
EQ? 1.3 ORGANIZING DATA • Multiplication and Division Rules: • The answer should have the same number of significant figures as the least precise value in the calculation. • Example: 15 x 3 = 452sf 1sf answer • The answer rounds to 1 sig fig: 50 INSERTPICTURE
EQ? 1.3 ORGANIZING DATA • Addition and Subtraction Rules: • The answer cannot have more decimal places than the least number of decimalplaces in the calculation. • Example: 1 5 . 5 tenths position+ 3 . 0 1hundredths position 1 8 . 5 1The answer rounds to the tenths position: 18.5! INSERTPICTURE