Download
1 / 29
290 likes | 324 Views
Learn about unbiased sample collection, recognize biased sampling, and importance of systematic methods in gathering data. Explore various sampling designs and their advantages and disadvantages.

E N D
Collecting Data Understanding Random Sampling
Objectives: • To develop the basic properties of collecting an unbiased sample. • To learn to recognize flaws in biased sampling.
Intro… Do you know what it means when something occurs randomly? Randomly select a number from the next slide. Ready…
Question: What would you except to happen if when we collected data on this simple task?
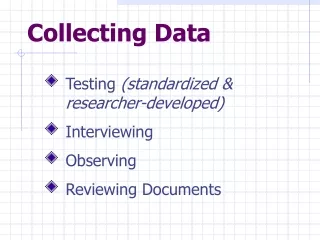
How do we gather data? • Surveys • Opinion polls • Interviews • Studies • Observational • Retrospective (past) • Prospective (future) • Experiments
Population Population – the entire group of individuals we want information about. Census – a complete count of the entire population
Not accurate Very expensive Perhaps impossible If using destructive sampling, you would destroy population Breaking strength of soda bottles Lifetime of flashlight batteries Safety ratings for cars Why would we not use a census all the time?
A part of the population that we examine in order to gather information Used to generalize information about a population Sample
refers to the methodused to choose the sample from the population Sampling design Sampling frame • a list of every individual in the population
consist of n individuals from the population chosen in such a way that every individual has an equal chance of being selected every set of n individuals has an equal chance of being selected Simple Random Sample (SRS)
Advantages Unbiased Easy Disadvantages Large variance May not be representative Must have sampling frame (list of population) SRS
select sample by following a systematic approach randomly select where to begin Systematic random sample
Advantages Unbiased Ensure that the sample is distributed across population More efficient, cheaper, etc. Disadvantages Large variance Can be confounded by trend or cycle Formulas are complicated Systematic Random Sample
Identify the sampling design A local restaurant manager wants to survey customers about the service they receive. Each night the manager randomly chooses a number between 1 & 10. He then gives a survey to that customer, and to every 10th customer after them, to fill it out before they leave. Systematic random sampling
ERROR favors certain outcomes Note: We cannot ever draw conclusions from bias data. Throw it out and start over! Bias
People chose to respond Usually only people with very strong opinions respond Produces biased results Voluntary response
Ask people who are easy to ask Produces bias results Convenience sampling
Source of bias? Suppose that you want to estimate the total amount of money spent by students on textbooks each semester at Rice. You collect register receipts for students as they leave the bookstore during lunch one day. Convenience sampling – easy way to collect data
1970 Draft Lottery and the Role of Randomization In that first draft lottery (conducted on December 1, 1969), a large, deep, cylindrical bowl was filled with 366 dates, one for each day of the year (including February 29, of course). The dates were placed inside small capsules (balls about the size of a pecan), added to the bowl, and then mixed. After mixing, the capsules were selected, one by one, and assigned a draft priority. Draft registrants whose birthdays matched the first 100 or so dates selected were likely to be called for induction. However, the bowl's small diameter and height (nearly arm's length) made the mixing less than random because each month's dates had been added sequentially in the yearly order of months. January's capsules were dumped in first, followed by February's and so on until December. Set of Data for 1970 Draft Lottery
How did the nonrandomness of the draft effect the casualties (deaths) during the Vietnam war? This was recently studied by Paul Sommers in "The Writing on the Wall", Chance, Vol, 1, 2003, p35-38. He examined the names of the casualties on the Vietnam Memorial (available online at thewall-usa.com) together with other sources and found the number of casualties by birth month:
Selecting a SRS • For the AP exam: “Knowledgeable users of statistics need to be able to perform your sample exactly using the described method.” • Methods: we can “pick samples from a hat”, use a random number generator, or use a table of random digits to derive our sample
SRS by picking out of a hat • Say items in hat are “mixed thoroughly” and state whether or not slips of paper are replaced back in the hat (yes if stratified sampling).
each entry is equally likely to be any of the 10 digits digits are independent of each other Random digit table
Suppose your population consisted of these 20 people: 1) Aidan 6) Fred 11) Kathy 16) Paul 2) Bob 7) Gloria 12) Lori 17) Shawnie 3) Chico 8) Hannah 13) Matthew 18) Tracy 4) Doug 9) Israel 14) Nancy 19) Uncle Sam 5) Edward 10) Jung 15) Opus 20) Vernon Use the following random digits to select a sample of five from these people. 1) Aidan We will need to use double digit random numbers, ignoring any number greater than 20. Start with Row 1 and read across. 13) Matthew 18) Tracy 5) Edward 15) Opus Ignore. Ignore. Ignore. Ignore. Row 1 4 5 1 8 0 5 1 3 7 1 20 1 5 5 8 0 1 5 7 0 38 9 9 3 4 3 5 0 6 3 Stop when five people are selected. So my sample would consist of : Aidan, Edward, Matthew, Opus, and Tracy