Download
1 / 1
10 likes | 114 Views
Leveraging the Absence of Observations: Pattern Recognition in Spatiotemporal Behavioral Data for Site and Purpose Discovery. Michael J. Haass, Mark H. Van Benthem, Edward M. Ochoa, Hyrum Anderson, Kristina R. Czuchlewski. Abstract. Case Study – Site Discovery.

E N D
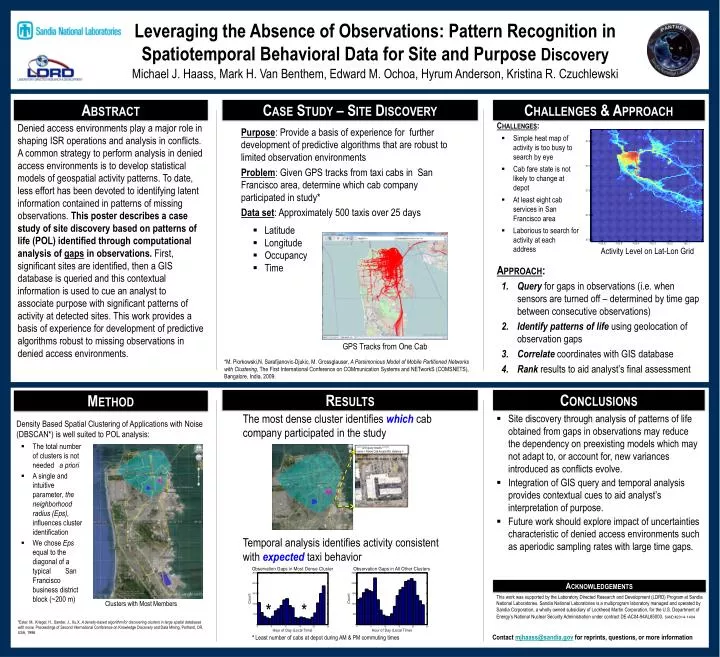
Leveraging the Absence of Observations: Pattern Recognition in Spatiotemporal Behavioral Data for Site and Purpose Discovery Michael J. Haass, Mark H. Van Benthem, Edward M. Ochoa, Hyrum Anderson, Kristina R. Czuchlewski Abstract Case Study – Site Discovery Challenges & Approach • Challenges: • Simple heat map of activity is too busy to search by eye • Cab fare state is not likely to change at depot • At least eight cab services in San Francisco area • Laborious to search for activity at each address Denied access environments play a major role in shaping ISR operations and analysis in conflicts. A common strategy to perform analysis in denied access environments is to develop statistical models of geospatial activity patterns. To date, less effort has been devoted to identifying latent information contained in patterns of missing observations. This poster describes a case study of site discovery based on patterns of life (POL) identified through computational analysis of gaps in observations. First, significant sites are identified, then a GIS database is queried and this contextual information is used to cue an analyst to associate purpose with significant patterns of activity at detected sites. This work provides a basis of experience for development of predictive algorithms robust to missing observations in denied access environments. Activity Level on Lat-Lon Grid Approach: Query for gaps in observations (i.e. when sensors are turned off – determined by time gap between consecutive observations) Identify patterns of life using geolocationof observation gaps Correlate coordinates with GIS database Rankresults to aid analyst’s final assessment Results Conclusions Method ***** GIS query results ******* name = Yellow Cab Access Rd, distance = 27.7 (yds) name = Potrero Hill, distance = 1239.2 (yds) The most dense cluster identifies whichcab company participated in the study • Purpose: Provide a basis of experience for further development of predictive algorithms that are robust to limited observation environments • Problem: Given GPS tracks from taxi cabs in San Francisco area, determine which cab company participated in study* • Data set: Approximately 500 taxis over 25 days • Latitude • Longitude • Occupancy • Time • Site discovery through analysis of patterns of life obtained from gaps in observations may reduce the dependency on preexisting models which may not adapt to, or account for, new variances introduced as conflicts evolve. • Integration of GIS query and temporal analysis provides contextual cues to aid analyst’s interpretation of purpose. • Future work should explore impact of uncertainties characteristic of denied access environments such as aperiodic sampling rates with large time gaps. Density Based Spatial Clustering of Applications with Noise (DBSCAN*) is well suited to POL analysis: • The total number of clusters is not needed a priori • A single and intuitive parameter, the neighborhood radius (Eps), influences cluster identification • We chose Eps equal to the diagonal of a typical San Francisco business district block (~200 m) Temporal analysis identifies activity consistent with expectedtaxi behavior Clusters with Most Members Acknowledgements This work was supported by the Laboratory Directed Research and Development (LDRD) Program at Sandia National Laboratories. Sandia National Laboratories is a multiprogram laboratory managed and operated by Sandia Corporation, a wholly owned subsidiary of Lockheed Martin Corporation, for the U.S. Department of Energy’s National Nuclear Security Administration under contract DE-AC04-94AL85000. SAND #2014-1404 * * • GPS Tracks from One Cab • *M. Piorkowski,N. Sarafijanovic-Djukic, M. Grossglauser, A Parsimonious Model of Mobile Partitioned Networks with Clustering, The First International Conference on COMmunication Systems and NETworkS (COMSNETS), Bangalore, India, 2009. • *Ester, M., Kriegel, H., Sander, J., Xu,X. A density-based algorithm for discovering clusters in large spatial databases with noise. Proceedings of Second International Conference on Knowledge Discovery and Data Mining, Portland, OR, USA, 1996. * Least number of cabs at depot during AM & PM commuting times Contactmjhaass@sandia.govfor reprints, questions, or more information