Download
1 / 8
80 likes | 98 Views
The evidence suggests reducing LDL-C levels significantly lowers the risk of cardiovascular disease. This study analyzes data from various trials and meta-analyses to determine the impact of different LDL-C targets on the reduction of CHD risk.

E N D
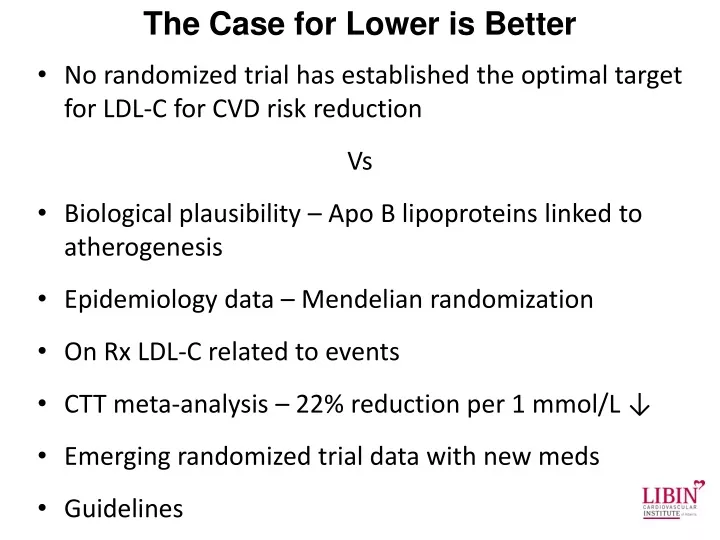
The Case for Lower is Better • No randomized trial has established the optimal target for LDL-C for CVD risk reduction Vs • Biological plausibility – Apo B lipoproteins linked to atherogenesis • Epidemiology data – Mendelian randomization • On Rx LDL-C related to events • CTT meta-analysis – 22% reduction per 1 mmol/L ↓ • Emerging randomized trial data with new meds • Guidelines
Ferrence BA, et al. J Am CollCardiol. 2012;60(25):2631-9. CHD Reduction from Earlier LDL-C Lowering: Lifetime low LDL Lifetime lower LDL-C due to genetics resulted in a 3-fold greater reduction in the risk of CHD per unit lower LDL-C than that observed during treatment with a statin started later in life Association between 1mmol/L lower LDL-C and risk of CHD
No. of events (% pa) Relative risk (CI) per mmol/L LDL-C reduction Statin/more Control/less More vs less statin 704 (17.9%) 795 (20.2%) 0.71 (0.52 - 0.98) <2.0 ³2,<2.5 1189 (18.4%) 1317 (20.8%) 0.77 (0.64 - 0.94) Proportional effects on MAJOR VASCULAR EVENTS per mmol/L LDL-C reduction, by baseline LDL-C ³2.5,<3.0 1065 (20.1%) 1203 (22.2%) 0.81 (0.67 - 0.97) ³3,<3.5 517 (20.4%) 633 (25.8%) 0.61 (0.46 - 0.81) 303 (23.9%) 398 (31.2%) 0.64 (0.47 - 0.86) ³3.5 3837 (19.4%) 4416 (22.3%) 0.72 (0.66 - 0.78) Total Statin vs control 206 (9.0%) 217 (9.7%) 0.87 (0.60 - 1.28) <2.0 ³2,<2.5 339 (7.7%) 412 (9.1%) 0.77 (0.62 - 0.97) ³2.5,<3.0 801 (8.2%) 1022 (10.5%) 0.76 (0.67 - 0.86) ³3,<3.5 1490 (10.8%) 1821 (13.3%) 0.77 (0.71 - 0.84) 4205 (12.6%) 5338 (15.9%) 0.80 (0.77 - 0.84) ³3.5 7136 (11.0%) 8934 (13.8%) 0.79 (0.77 - 0.81) Total All trials 910 (14.7%) 1012 (16.4%) 0.78 (0.61 - 0.99) <2.0 ³2,<2.5 1528 (14.0%) 1729 (15.9%) 0.77 (0.67 - 0.89) 99% or 95% CI ³2.5,<3.0 1866 (12.4%) 2225 (14.7%) 0.77 (0.70 - 0.85) ³3,<3.5 2007 (12.3%) 2454 (15.2%) 0.76 (0.70 - 0.82) 4508 (13.0%) 5736 (16.5%) 0.80 (0.76 - 0.83) ³3.5 10973 (13.0%) 13350 (15.8%) 0.78 (0.76 - 0.80) Total 0.5 0.75 1 1.25 1.5 Statin/more better Control/less better
GLAGOV: Objective Objective • To test the hypothesis that LDL-C lowering with a monthly subcutaneous injection of evolocumab 420 mg for 78 weeks will result in a significantly greater change from baseline in percentage atheroma volume (PAV) compared with placebo in subjects taking background statin therapy Design • A 78-week, randomized, double-blind, placebo-controlled, multicenter, phase 3 study. Nicholls SJ, et al. JAMA. [published online ahead of print November 15, 2016]. doi: 10.1001/jama.2016.16951.Puri R, et al. Am Heart J. 2016;176:83-92.
Mean LDL-C 2.41 mmol/L* Mean Absolute Change in LDL-C Change from baseline 3.9% Statin monotherapy Statin + evolocumab 0.2 Mean LDL-C 0.95 mmol/L* 0 –0.2 Change from baseline -59.8% –0.4 –0.6 LDL-C Absolute Change From Baseline, mmol/L –0.8 –1.0 –1.2 –1.4 –1.6 –1.8 0 4 8 12 16 20 24 28 32 36 40 44 48 52 56 60 64 68 72 76 80 Study Week No. of patients Placebo 484 446 441 447 441 425 418 Absolute change for evolocumab-statin group: -1.46 (-1.54 to -1.38); P < 0.001 Evolocumab 484 456 452 444 449 426 434 Data shown are Mean (95% CI) *Time-weighted LDL-C; LDL-C = low-density lipoprotein cholesterol Nicholls SJ, et al. JAMA. [published online ahead of print November 15, 2016]. doi: 10.1001/jama.2016.16951. Nissen SE, et al. American Heart Association Scientific Sessions, Nov 12 - 16, 2016,New Orleans, Louisiana. Oral Presentation.
Primary Endpoint: Nominal Change in PAV From Baseline to Week 78 P = NS* Change in % atheroma volume (%) P < 0.001* Difference between groups: -1.0% (-1.8 to -0.64); P < 0.001 Data shown are least-squares mean (95% CI). PAV = Percent Atheroma Volume *Comparison versus baseline Nicholls SJ, et al. JAMA. [published online ahead of print November 15, 2016]. doi: 10.1001/jama.2016.16951.
FRS – modified Framingham Risk Score; ACR – albumin:creatinine ratio; * consider LDL-C < 1.8 mmol/L for subjects with ACS within last 3 months