Download
1 / 21
220 likes | 394 Views
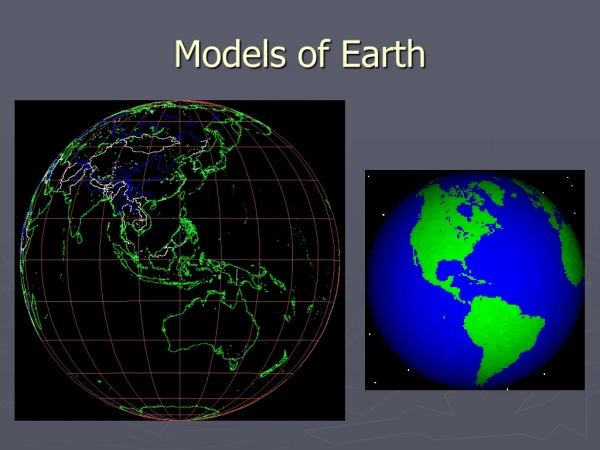
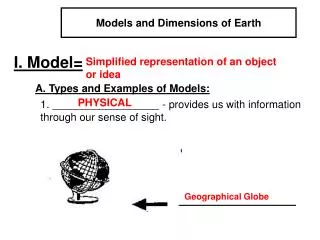
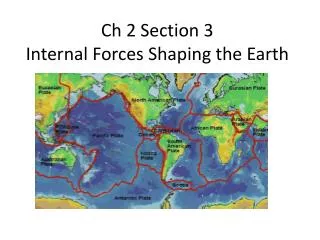
CH 3 Models of the Earth. Topics. Know how latitude and longitude are set up (If given a point you should be able to find a general location on the earth) Map projections If given a projection you should be able to state what type of projection it is

E N D
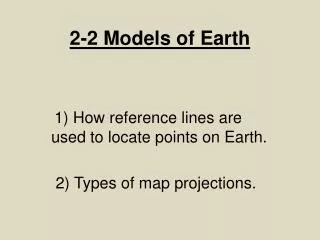
Topics • Know how latitude and longitude are set up (If given a point you should be able to find a general location on the earth) • Map projections • If given a projection you should be able to state what type of projection it is • Explain how the different projections distort the Earth • Be able to analyze a topographic map by indentifying landforms from the contour lines • Explain the difference between soil maps and geologic maps • If given any type of map you are able to make conclusions and analysis
Latitude and Longitude • Points of Interest • North and South Pole • Equator- Separates North and South Pole
Latitude • Run East and West (run parallel) • Parallel to the equator 0º • Poles are 90º N and 90º S • 1º = 60 minutes • 1 minute = 60 seconds • Washington DC 38º53 23 N
Longitude • Angular distance east or west of the prime meridian • West-East locations • Established by using meridians – a semicircle that runs from pole to pole. • Prime Meridian is 0º passes through Greenwich, England
Magnetic Compass • Pg 55 Figure 4 • The needle of a compass points to the geomagnetic north pole, not the Geographic North • Pg 56 1-7 Review
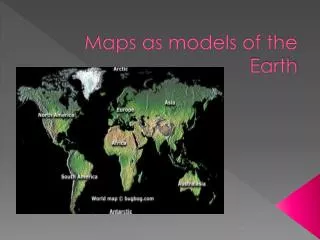
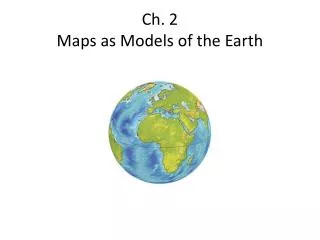
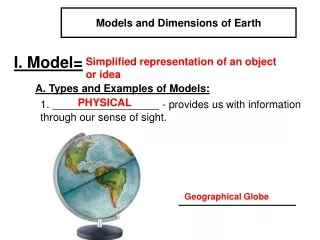
3.2 Mapping Earth’s Surface • Cartography- the science of making maps. • A map is a flat representation of Earth’s curved surface. • Larger the map, the larger the distortion • Map of USA vs. Map of America
Map Projections • A flat map that represents the 3-D curved surface of a globe.
Cylindrical Projections • Meridians, or latitude lines, would appear straight not curved • Accurate near equator, not at poles • Pg 58
Azimuthal (az uh MYOOTH uhl) Projections • A horizontal look at a point on the earth. • Used best for the N and S Pole • Cause distortions with distance and direction. • Used in air travel • Great circle is shortest distance • Pg 59
Conic Projections • Areas near the parallel where the cone and globe are in contract are distorted the least. • Pg 59
Reading a Map • N is always towards the top • Compass Rose shows the cardinal directions (N,S,E,W) • Legend- gives symbols for features such as rivers, mountains, and cities. • Drawn to scale- MUST BE- represents the relationship between the distance shown and the actual distance.
Isograms • Meteorologists use them to show changes in atmospheric pressure on weather maps • (isobars) • Show areas that have similar measurements of precipitations, temp, gravity, magnetism, density, elevation, or chemical composition.
3.3 Types of Maps • Topographic Maps • Most Common • Show the surface features, or topography • Show natural and unnatural features • Elevation- the height above sea level • Pros- shows shape, size, and elevation
Question • What’s the elevation at sea level?
Topography Maps • Contour lines show elevation. • Relief- The difference in elevation between the highest and lowest points of the area being mapped.
Landforms • Contour lines spaced widely apart indicate that the change in elevation is gradual. • Closely spaced contour lines indicate that the change in elevation is rapid/steep • Pg 65 Figure 3
Landforms • A contour line that bends to form a V shaped valley, indicates a valley • A closed loop indicates a hilltop or a depression/dip
Symbols • Built structures- black • Highways- red • Water- blue • Forests- green • Contour lines- black or brown • Make sure to use the map key/legend
Geologic Maps • Shows geologic features • Show types of rocks, faults, folds, and other structures
Soil Maps • Based off of soil surveys • The Natural Resources Conservation Service is in charge of overseeing and compiling soil data. • Soil Surveys • Text, maps, and tables • Text- general info about the geology, topography, and climate of the areas being mapped • Table- types and volume of soil in the area • Maps- detailed info about soil, and where they are Pg 67