Download
1 / 19
190 likes | 397 Views
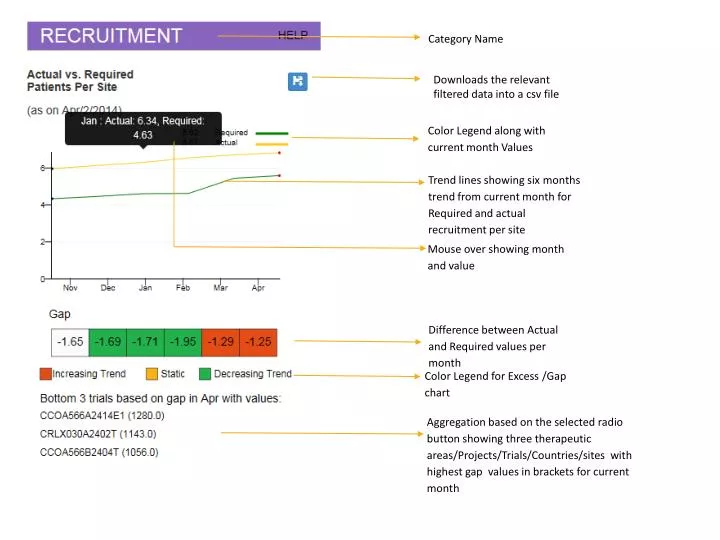
Category Name. Downloads the relevant filtered data into a csv file. Color Legend along with current month Values. Trend lines showing six months trend from current month for Required and actual recruitment per site. Mouse over showing month and value.

E N D
Category Name Downloads the relevant filtered data into a csv file Color Legend along with current month Values Trend lines showing six months trend from current month for Required and actual recruitment per site Mouse over showing month and value Difference between Actual and Requiredvalues per month Color Legend for Excess /Gap chart Aggregation based on the selected radio button showing three therapeutic areas/Projects/Trials/Countries/sites with highest gap values in brackets for current month
Category Name Downloads the relevant filtered data into a csv file Color based on last month and current month value trend Current Month value MoM Growth value Color legend Six months trend,red dot indicating current month Aggregation based on the selected radio button showing three therapeutic_area/project/ trial/site with highest median time to data entry for current month
Category Name Downloads the relevant filtered data into a csv file Bar chart showing previous six months trend Line chart showing previous six months trend Aggregation based on the selected radio button showing three therapeutic_area/project/ trial/sites that have minimum visits in current month Mouse over showing additional details Aggregation based on the selected radio button showing three therapeutic_area/project/ trial/sitesthat take maximum days to complete report in current month
Category Name Downloads the relevant filtered data into a csv file x/y -x shows no of trials where roll up is matching out of total y trials for given milestone Validation shows tick for milestone when validation matches for all the trials Download underlying data x/y -x shows no of trials where roll up is not matching out of total y countriesfor given milestone Validation shows cross for milestone when validation doesn’t matches for all the countries
Category Name Downloads the relevant filtered data into a csv file Current Month value MoM Growth value Six months trend,red dot indicating current month Top 8 categories based on total no of open issues for the past six months % No of issues open in that bucket to total no of issues open in that category Color Legend Aggregation based on the selected radio button showing three therapeutic_area/project/ trial/site with highest % of open issues for current month
Category name Downloads the relevant filtered data into a csv file Mouse Over shows year and value Six years trend line.red dot indicateing current year | Presentation Title | Presenter Name | Date | Subject | Business Use Only
Category Name Downloads the relevant filtered data into a csv file Color Legend along with current yearValues Trend lines showing six years trend from current yearfor Requiredand actual recruitment per site Mouse Over showing year and Actual, Required Values Difference between Actual and requiredvalues per year Color Legend for Excess /Gap color legend for Gap
Category Name Downloads the relevant filtered data into a csv file Six years trend line.red dot indicateing current year Current Year value YoY Growth rate Color legend Mouse Over shows year and values
Category Name Downloads the relevant filtered data into a csv file Mouse Over showing year and open,closed values Six years trend Line . Red dot indicates current year Color legendand current year value | Presentation Title | Presenter Name | Date | Subject | Business Use Only
Category Name Downloads the relevant filtered data into a csv file Current Year value YOY growth rate Mouse Over showing year and value Color legend | Presentation Title | Presenter Name | Date | Subject | Business Use Only
Category Name Downloads the relevant filtered data into a csv file Current Month value MoM Growth value Six months trend,red dot indicating current month Top 8 categories based on highest % >90 daysqueries for the past six months Color Legend Aggregation based on the selected radio button showing three therapeutic_area/project/ trial/site with highest % PD and time to close for current month
Category Name Downloads the relevant filtered data into a csv file Mouse over showing month and value Current Month value MoM Growth value Six months trend,red dot indicating current month Color based on last month and current month value trend Color legend Aggregation based on the selected radio button showing three therapeutic_area/project/ trial/sites with highest no of sites for current month
Category Name Downloads the relevant filtered data into a csv file Mouse over showing additional details Bar chart showing previous six months trend Line chart showing previous six months trend Aggregation based on the selected radio button showing three trials having minimum % values in current month
Category Name Downloads the relevant filtered data into a csv file Three countries having least days difference between the milestones Box plot plotting 5 to 95 percentile days difference values for all countries
Category Name Downloads the relevant filtered data into a csv file Three trials having least days difference between the milestones Box plot plotting 5 to 95 percentile days difference values for all trials
Downloads the relevant filtered data into a csv file Three sites having least days difference between the milestones Box plot plotting 5 to 95 percentile days difference values for all trials
Category Name Downloads the relevant filtered data into a csv file Color Legend Mouse Over Trend lines showing six months trend from current month for open and closed queries Aggregation based on the selected radio button showing three therapeutic_area/project/ trial/sites with highest cumulative open % value for current month
Category Name Downloads the relevant filtered data into a csv file Trend lines showing six months trend from current month Mouse over showing details Aggregation based on the selected radio button showing three therapeutic_area/project/ trial/sites with highest % >90 days for current month
Category name Downloads the relevant filtered data into a csv file Current month value MoM Growth value Six months trend Number of trials in that bucket Trend lines showing six months trend from current month Aggregation based on the selected radio button showing three therapeutic_area/project/ trial/siteswith highest % value for current month