Download
1 / 19
190 likes | 310 Views
Observation-constrained probabilistic evaluation of modeled concentrations and sensitivities. Daniel Cohan and Antara Digar CMAS Conference October 16, 2012. Causes of Uncertainty in Modeled Concentrations & Sensitivities. Error in model input parameters: Emission rates

E N D
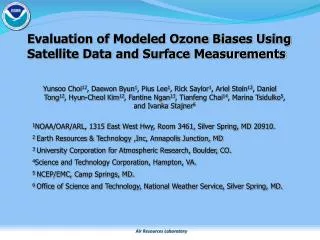
Observation-constrained probabilistic evaluation of modeled concentrations and sensitivities Daniel Cohan and Antara Digar CMAS Conference October 16, 2012
Causes of Uncertainty in Modeled Concentrations & Sensitivities • Error in model input parameters: • Emission rates • Reaction rate constants • Boundary conditions • Deposition velocities • Imperfections in numerical representations of atmospheric processes: • Emission model • Chemical mechanism • Transport schemes • Meteorology model
O3 sensitivities more responsive than concentrations to uncertain reaction rates 8-hour results averaged over episode for 2-km Houston domain Cohan et al., Atmos. Environ. (2010), 3101-3109
Reduced Form Model approach to characterize parametric uncertainty Taylor Series Expansions: Digar et al., ES&T 2011
Performance of Reduced Form Model Brute Force Reduced Form Model 8-hour Ozone Impact of -50% Atlanta NOx if ENOx, EVOC, and Jphot all +50% 24-hour PM Sulfate Impact of -50% Atlanta SO2if ESO2, ENH3, and Jphot all +50% R2 > 0.99, NME < 10% in each case Digar and Cohan, ES&T 2010
Retrospective case study: Likelihood of achieving 1.5 ppb target in Atlanta Digar et al., ES&T 2011a
constrained constrained Observation-Constrained Monte Carlo with structural & parametric uncertainties Digar et al., JGR in revision
Modeling and Observations (8-h O3 & 24-h NOX) Note: NOX concentrations were bias-corrected for interference with other nitrogen species based on the work of Lamsal et al., JGR, 2008.
Uncertainties Considered • Structural Scenarios • MOZART* and GEOS-Chem boundary conditions • GloBEIS* and MEGAN biogenic emissions • CB-05* and CB-6 chemical mechanisms • Slinn* and Zhang deposition schemes • Parametric Uncertainties • Emissions: Domain-wide NOx, BVOC, and AVOC • Chemical reaction rate constants: R(OH+NO2), R(NO+O3), R(VOCs+OH), J(photolysis) • Boundary conditions: O3, NOx, HNO3, PAN, HONO, N2O5 *: Default
DFW sensitivities under each structural case • All show predominately NOx-limited • CB-6 favors VOC sensitivity • MEGAN favors NOx sensitivity • Boundary conditions do not affect sensitivities • Zhang deposition affects sensitivities only at night • Similar trends for Houston sensitivities (Aug-Sept episode) MEGAN CB-6 CB-6 MEGAN Zhang
Metric 1 (Bayesian Inference Method) Likelihood that a model prediction (C) is correct given observation (O), M = 4000 For 8-hr O3, = 7.2 ppb For 24-hr NOx, = 8.2 ppb Based on 5 years of data (2004 – 2008) Bergin et al. 1999 Assumption: errors in the interpolated observed concentrations are independent & normally distribution with mean zero Episode-average 8-hr O3 and 24-hr NOx at 11 sites N = 11 A posteriori probability for C (applying Bayes’ Theorem), Prior probability,
Metric 2 (EPA Screening) Screening cases that pass all of the following test criteria for 8-hr Ozone, Mean Normalized Gross Error -5% < MNGE < +5% Mean Normalized Bias -15% < UPA < +15% MNB < 30% Unpaired Peak Accuracy 8-hr O3 at all sites and days N = 289 Note: MNB and MNGE were computed for model results (Model) when O3 observations (Obs) were greater than the recommended threshold of 60 ppb [USEPA, 2007]
Metric 3 (Cramer-von Mises) The Cramér-von Mises (CvM) criterion [Anderson, 1962] provides a non-parametric test of the null hypothesis (H0) that two samples are drawn from the same (unspecified) distribution F(yi) G(xi) CDF of y CDF of x N Model Predictions (x) N Observations (y) G(y) F(x) x1 x2 yi xn y2 xi yn y1 For each mth simulation, One rejects the null hypothesis that F(x)G(y) if T is too large We select only those cases that yields p-values > 0.1, for both of the two observational constraints (O3 and NOX) 8-hr O3 (N = 289) and 24-hr NOx (N = 303) at all sites and days
Observation-constrained distribution of NOx Emission Scaling Factors ENOX Higher NOx emissions were needed to better match with observations (particularly for Metrics 2 and 3) Digar et al., JGR in revision
A priori ozone sensitivity ratios at Denton monitor Digar et al., JGR in revision
Observation-constrained sensitivity ratio SO3,NOx/SO3,VOC Cumulative Distribution Functions for Ratio (SNOx : SVOC) Negative shift in the posterior CDFs (particularly for Metric 2 and 3) indicate slight preference towards SVOC, although the region is predominantly NOx-limited (i.e. SNOx : SVOC > 1.0 ) Digar et al., JGR in revision
Conclusions • Efficient reduced form model for probabilistic characterization of concentrations and sensitivities • Observation-based constraints can adjust distributions of input parameters, concentrations, and sensitivities • Limitations: • Results depend on choice of observational metric • Does performance vs observed concentrations indicate better inputs and sensitivities, or compensating errors? • RFM only as good as the underlying model • Future research could link uncertainty analysis with dynamic evaluation
Acknowledgments • Dr. Xue Xiao • Dr. Kristen Foley, US EPA • Dr. Greg Yarwood and Dr. Bonyoung Koo, ENVIRON • TCEQ • Funding: • US EPA STAR Grant #R833665 • NSF CAREER Award • Texas Air Quality Research Program