Download
1 / 5
50 likes | 100 Views
Investigating LexA binding sites in cyanobacteria and model organisms (B. subtilis, a-proteobacteria, E. coli) via phylogenetic tree and sequence logos. Genome-wide scanning and multiple sequence alignments are conducted. Comparison with reference databases.

E N D
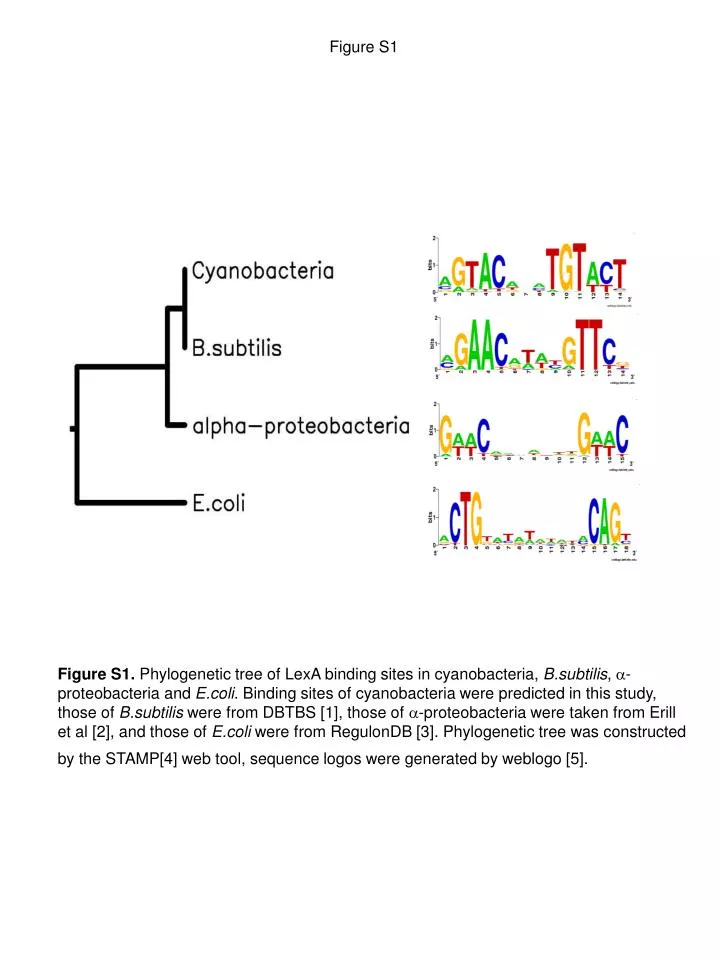
Figure S1 Figure S1. Phylogenetic tree of LexA binding sites in cyanobacteria, B.subtilis, a-proteobacteria and E.coli. Binding sites of cyanobacteria were predicted in this study, those of B.subtilis were from DBTBS [1], those of a-proteobacteria were taken from Erill et al [2], and those of E.coli were from RegulonDB [3]. Phylogenetic tree was constructed by the STAMP[4] web tool, sequence logos were generated by weblogo [5].
p(SIu > s) p(SCu > s) LOR N(SIu > s) Figure S3 Synechococcus sp. JA-2-3B'a (2-13) B-Prime Synechococcus sp. JA-3-3Ab A-Prime Thermosynechococcus_elongatus BP-1 Trichodesmium_erythraeum_IMS101 Probability or LOR Number of predicted LexA boxes Score Synechococcus_elongatus_PCC_6301 Score Figure S3. Results of genome-wide scanning for LexA-like binding sites in the five genomes that do not encode a LexA protein.
Figure S4 Figure S4. Multiple sequence alignments of the full-length LexA in the 27 cyanobacterial genomes. The sequence from E.coli LexA is also included for comparison. The auto-cleavage sites are indicated by a red arrow, and the reactive residues are indicated by red dots.
t g1 g2 Figure S5 putative binding site h T o1(g1), o1(g2) G1 g1 g2 o2(g1) o2(g2) g2 g1 G2 in this example. For o1(g1), o2(g1) and o2(g2), assume they have the same value of sequence similarity to h,i.e., . Then we should select orthologs of g1 in this case, i.e., i =1, and add its average score across genome G1and G2 to SM(t).
References • Sierro N, Makita Y, de Hoon M, Nakai K: DBTBS: a database of transcriptional regulation in Bacillus subtilis containing upstream intergenic conservation information. Nucleic Acids Res 2008, 6(Database issue):D93-96. • Erill I, Jara M, Salvador N, Escribano M, Campoy S, Barbe J: Differences in LexA regulon structure among Proteobacteria through in vivo assisted comparative genomics. Nucleic Acids Res 2004, 32(22):6617-6626. • Gama-Castro S, Jimenez-Jacinto V, Peralta-Gil M, Santos-Zavaleta A, Penaloza-Spinola MI, Contreras-Moreira B, Segura-Salazar J, Muniz-Rascado L, Martinez-Flores I, Salgado H et al: RegulonDB (version 6.0): gene regulation model of Escherichia coli K-12 beyond transcription, active (experimental) annotated promoters and Textpresso navigation. Nucleic Acids Res 2008, 36(Database issue):D120-124. • Mahony S, Benos PV: STAMP: a web tool for exploring DNA-binding motif similarities. Nucleic Acids Res 2007, 35(Web Server issue):W253-258. • Crooks GE, Hon G, Chandonia JM, Brenner SE: WebLogo: a sequence logo generator. Genome Res 2004, 14(6):1188-1190.