Download
1 / 7
70 likes | 172 Views
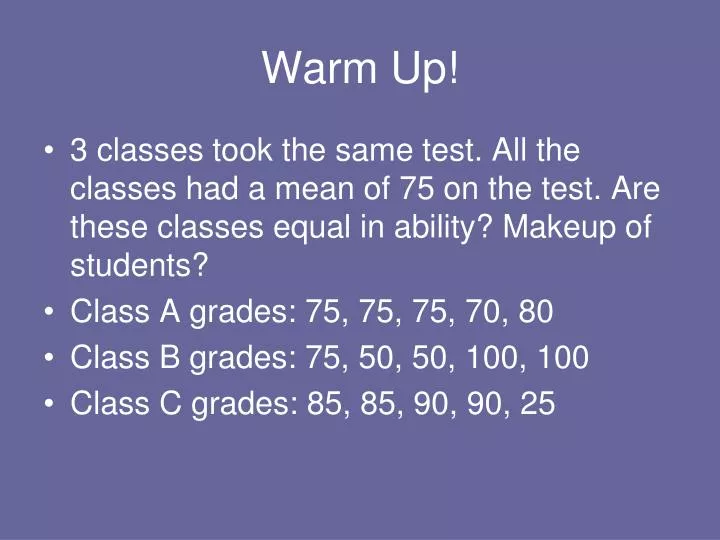
Warm Up!. 3 classes took the same test. All the classes had a mean of 75 on the test. Are these classes equal in ability? Makeup of students? Class A grades: 75, 75, 75, 70, 80 Class B grades: 75, 50, 50, 100, 100 Class C grades: 85, 85, 90, 90, 25.

E N D
Warm Up! • 3 classes took the same test. All the classes had a mean of 75 on the test. Are these classes equal in ability? Makeup of students? • Class A grades: 75, 75, 75, 70, 80 • Class B grades: 75, 50, 50, 100, 100 • Class C grades: 85, 85, 90, 90, 25
Measures of Dispersion (Spread) for Ungrouped Data Section 3.2
Measures of Dispersion • Spread or Variation of data give a better picture of the overall data than just Mean, Median or mode alone. • Range = Largest value – Smallest value.
Standard Deviation(S or σ) • Most used measure of spread. • Tells how close the data values are clustered around the mean. • Small Standard Deviation means values are close to mean. • Large Standard Deviation mean values are spread out from mean.
Variance (S2 or σ2) • Obtain the Standard deviation by taking the square root of the variance. Population: σ2 = ∑(x - µ)2 N Sample: S2 = ∑(x - x)2 n-1 • The sum of the deviations from the mean, ∑(x – x), is always 0, so we square them.
Standard Deviation and Variance • Are always positive. • Only = 0 if all values in data set are the same. • The unit of measure of Standard Deviation is the same as the data set. • Population Parameters – Numerical measures of the population. • Sample Statistics – Numerical measures of a sample.