Download
1 / 26
260 likes | 382 Views
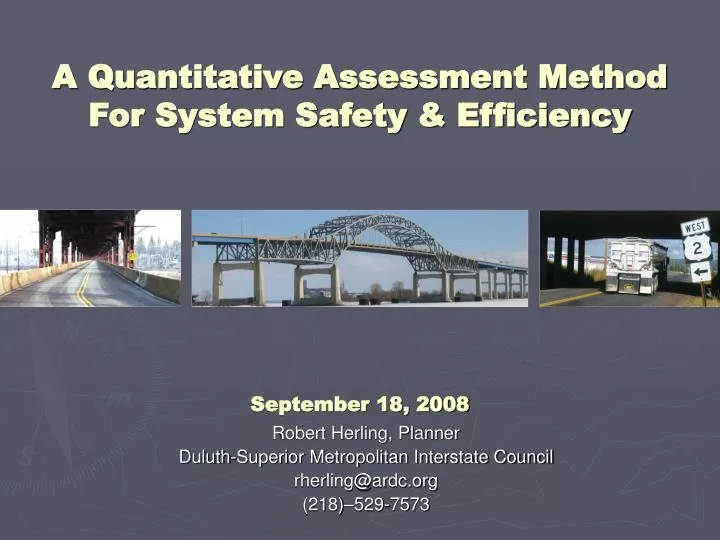
A Quantitative Assessment Method For System Safety & Efficiency. Robert Herling, Planner Duluth-Superior Metropolitan Interstate Council rherling@ardc.org (218)–529-7573. September 18, 2008. The methodology is…. NOT scientific NOT statistically significant

E N D
A Quantitative Assessment MethodFor System Safety & Efficiency Robert Herling, Planner Duluth-Superior Metropolitan Interstate Council rherling@ardc.org (218)–529-7573 September 18, 2008
The methodology is… • NOT scientific • NOT statistically significant • ISa way to measure relative performance • IS inexpensive • ISfair & balanced
MIC Project Objectives • perform a system-wide assessment • prioritize locations by needs • provide a method of monitoring Goal of Transportation Systems Management (TSM): Improved safety & efficiency through low-cost, high-benefit solutions
YEAR 1 • 6 Crashes per year • High crash rate • High severity rate Strategy: identify, quantify, and monitor… YEAR 3 YEAR 5 • 3 crashes per year • Reduced crash rate • High severity rate • 3 Crashes per year • Moderate crash rate • Low severity rate
Challenges: • running a system-wide analysis with any frequency • balancing safety and efficiency needs • balancing spot locations and road segments • comparing needs between two states Solutions: • thresholds to limit number of locations analyzed • address spot locations and road segments separately • do two separate assessments (MN & WI)
1 A B 2 C 3 D 4 E 5 F 6 Started with a previous concept: 0 2 4 6 8 10 Adjusted Scale 5 year crash trend Current crash severity Level of service Collector/ Collector Minor/ Collector Minor/ Minor Major/ Collector Major/ Minor Major/ Major Functional class
Initial attempt in 2005: • Only analyzed spot locations • Safety threshold: 3 or more crashes in most recent year • Mobility threshold: LOS D or poorer • Did not compare MN results with WI results
First assessment done in 2005: Locations ranked with weight values (LOS given more influence) For each location, analysis of conditions contributing to poor safety & capacity
Problems with 2005 assessment: • Too simplified • Crash rate not the best measure • Too much emphasis put on LOS Suggested improvements: • Use similar measures for both capacity and safety • Use same number of measures for both • Get rid of the weights
Improved methodology: Safety performance measures: • Crash frequency (Quantity) • Crash severity rate (Severity) • Average increase in crash rate (Change) Mobility performance measures: • AADT per lane mile (Quantity) • LOS (Severity) • % change in AADT (Change)
“Quantity measure” for safety: Average number of crashes per year (crashes2002 + 2003 + 2004 + 2005 + 2006)/ 4
[ ] ( ( ( ) ) ) total crashes x fatality crashes property damage crashes injury crashes x3 x2 x1 + + total years x 365 days x AADT “Severity measure” for safety: Number of equivalent property damage crashes per million vehicles
“Change measure” for safety: Average change in crash rate vs. base year’s change in crash rate (2002 to 2003) [(∆2003 + ∆2004 + ∆2005 + ∆2006)/ 4] – ∆2003 E 4th St & 6th Ave E State Hwy 194 & Mesaba Ave 0.5 0.5 2002 to 2003 5 yr Avg. - 0.34 Change in Rate Change in Rate 0 0 5 yr Avg. + 0.20 2002 to 2003 -0.5 -0.5 1 year 1 year
( ) AADT2006 / number of lanes x traffic control device factor where: No control (not an intersection) = .01 Roundabout = .02 Signal (protected L-turn for all) = .03 Signal (protected L-turn for some) = .04 Signal (no protected L-turns) = .05 Stop or Yield = .06 “Quantity measure” for mobility: AADT per lane (factored by traffic control type) 1 10 9 2 8 7 3 5 4 6
( ) A, B, C, D, E, F LOS A = 1 LOS A = 4 where: LOS B = 2 LOS E = 5 LOS C = 3 LOS F = 6 “Severity measure” for mobility: LOS as identified by TP Plus model
[ ] (AADT2006 - AADT2002)/AADT2002 Major arterial = 5 Minor arterial = 4 Major collector = 3 where: Major collector = 2 Local road = 1 “Change measure” for mobility: % change in AADT from 1st year to last year (adjusted by func. class) + (FC1 + FC2 +… FCn) / 100
How can these things be compared? • Indexing Ij = -100(X/R)+100 Creates an individual score between 0 - 100 n • Composite scoring C = Σ(Ij) j - 1 Combines all individual scores for a final score between 0 - 600
/ ] [ ( ) ( ) worst severity rate best severity rate _ _ worst severity rate location’s Severity rate -100 x +100 • Indexing Ij = -100(X/R)+100 example:
) ( index value for % change in AADT + ) ) ) ( ( ( + index value for LOS index value for crash frequency index value for severity rate ) ( + + ) index value for AADT per lane mi ( index value for % change In crash rate n C = Σ(Ij) • Composite scoring j - 1 +
Can prioritize locations by composite score COMPOSITE SCORE INTERSECTIONS
Or analyze locations in how they rank by safety or efficiency COMPOSITE SCORE INTERSECTIONS
E 4th St & 6th Ave E: Mobility Issues * Lack of protected L-turns on E 4th St LOS C 6th Ave E 6th Ave E - Heading SW LOS D E 4th St E 4th St - Heading NE
Skyline Pkwy & W 7th St: Safety Issues * Sight distance issues Skyline Pkwy W 7th St W 7th St - Heading SW Skyline Pkwy - Heading NE
The methodology is… • NOT scientific • NOT statistically significant • ISa way to measure relative performance • IS inexpensive • ISfair & balanced
Questions? Robert Herling, Planner: rherling@ardc.org Duluth-Superior Metropolitan Interstate Council (MIC): www.dsmic.org